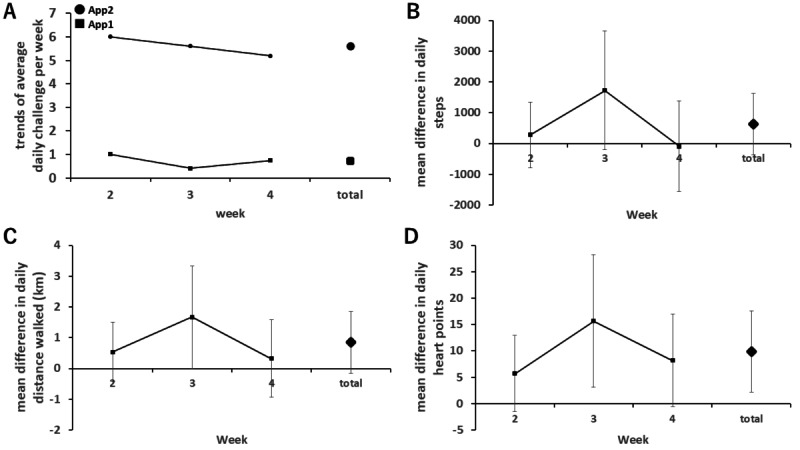
Figure 3.

The trends of each end point over 3 weeks are shown as follows; panel (A) illustrates the trends in the average number of challenges accomplished per week between app 1 and app 2. Panels (B), (C), and (D) display the difference in average daily steps, daily distance walked, and daily heart points earned per week between app 1 and app 2, respectively. The error bars represent the 95% CI.
