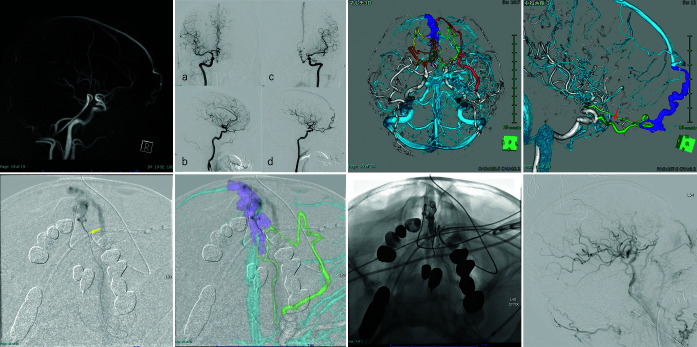
Figure 2:
(a) Brain magnetic resonance angiography and (b) Digital subtraction angiography reveal anterior cranial fossa-dural arteriovenous fistula. (a and b) Right ICA angiography. (c and d) Left ICA angiography. (c and d) A three-dimensional (3D) reconstructed vascular image visually aids in understanding the 3D angioarchitecture of the shunt. Color coding: Yellow, right anterior ethmoidal artery; orange, right posterior ethmoidal artery (PEA); red, left maxillary artery; green, left PEA; light green, left anterior cerebral artery (ACA). Red arrow: Beginning of the central retinal artery. (e) A front view shows the location of catheters navigated to the shunt through the left ACA. Yellow arrow: the microcatheter close to the shunt. (f) Intraoperative image with superimposed multi-fusion imaging. Image visualization is helped by making the multi-fusion imaging and intraoperative views the same. (g) Onyx penetrates the draining vein beyond the shunt pouch. (h) The shunt point is completely occluded by backflow from the shunt pouch to each feeder, and the shunt disappears.

