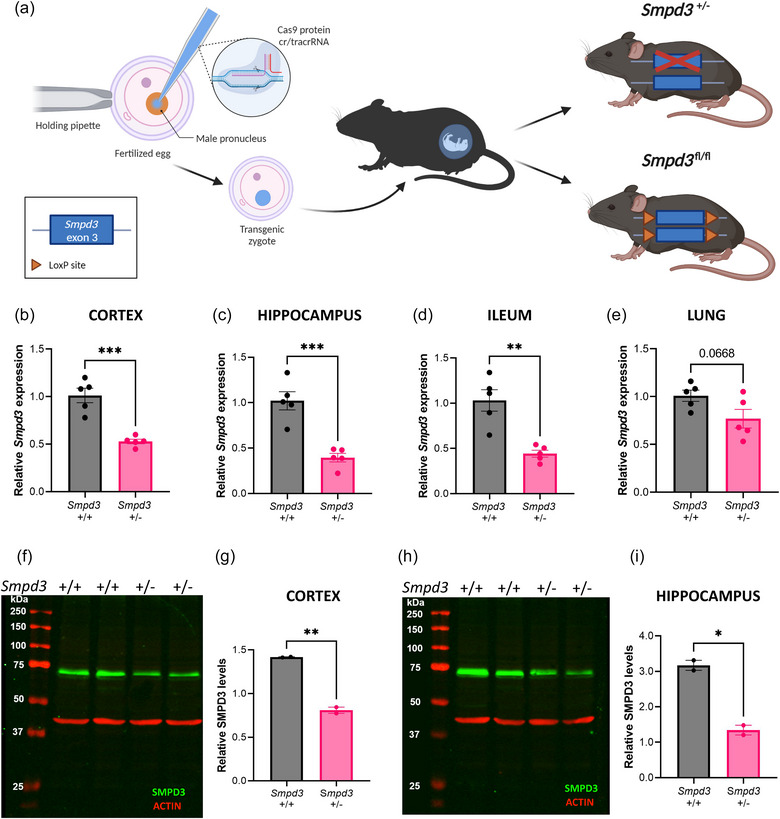
FIGURE 1.

Validation of Smpd3 deficiency in heterozygous Smpd3 knockout mice (Smpd3 +/−). (a) Schematic overview of the generation of Smpd3 deficient (Smpd3 +/− and Smpd3 fl/fl) mice using CRISPR/Cas9 technology. (b–e) Smpd3 expression levels evaluated with RT‐qPCR on cortical (b), hippocampus (c), ileum (d) and lung (e) tissue samples from Smpd3 +/+ (n = 5) versus Smpd3 +/− mice (n = 5). Results are represented relative to Smpd3 +/+. (f–i) SMPD3 western blot analysis (f, h) and quantification of the SMPD3 expression (70 kDa) normalized to ACTIN (42 kDa) (g, i) in cortical (f, g) and hippocampal (h, i) brain tissue from Smpd3 +/+ (n = 2) versus Smpd3 +/− mice (n = 2). Data are represented as means ± SEM. Statistical analyses were performed by unpaired t‐test (*p < 0.05, **p < 0.01, ***p < 0.001, ns, not significant). CRISPR, clustered regularly interspaced short palindromic repeats; cr/tracr RNA, crispr/trans‐activating crispr RNA; Smpd3, sphingomyelin phosphodiesterase 3.
