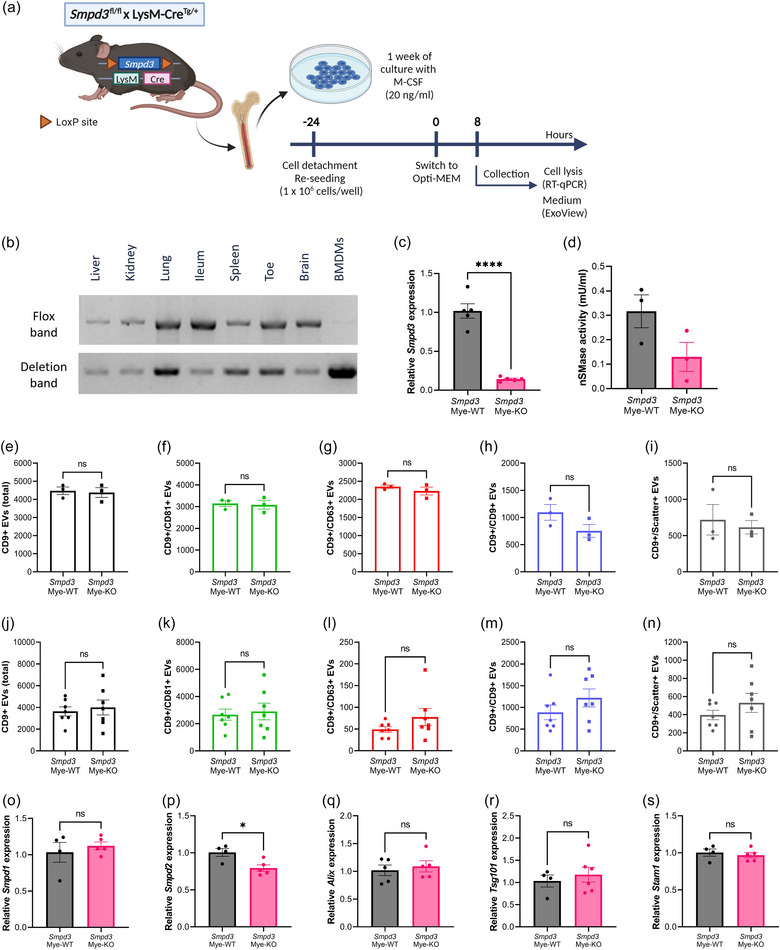
FIGURE 5.

Smpd3 deletion in bone marrow‐derived macrophages (BMDMs) does not affect the amount of EV release. (a) BMDMs were differentiated from whole bone marrow from Smpd3 fl/fl × LysM‐CreTg/+ (Smpd3 Mye‐KO) mice and Smpd3 fl/fl × LysM‐Cre+/+ (Smpd3 Mye‐WT). Twenty four hours before the start of the assays, BMDMs were re‐seeded at equal cell densities. At the start of incubation, the culture medium was switched to Opti‐MEM. Cells were lysed and culture medium was collected for analyses 8 h after switching to Opti‐MEM medium. (b) Deflox PCR on several myeloid cell‐containing organs and BMDMs derived from Smpd3Mye‐KO mice. The presence of the deletion band (402 bp) shows effective Cre‐mediated ‘defloxing’. The flox band (2121 bp) is absent in BMDMs while still present in the organs. (c) Smpd3 expression in BMDMs analysed with RT‐qPCR, relative to Smpd3Mye‐WT, showing efficient KO of Smpd3 on RNA level. (d) nSMase activity assay illustrating reduced nSMase enzyme activity in Smpd3Mye‐KO mice. (e–n) ExoView quantification of CD9+ EVs in BMDM culture medium (e–i) and plasma (j–n) from Smpd3Mye‐WT (n = 3–7) and Smpd3Mye‐KO (n = 3–7) mice, showing the total (e, j), CD81+ (f, k), CD63+ (g, l), CD9+ (h, m) and label‐free scatter+ (50–200 nm) (i, n) EVs captured on the CD9 spot. (O–S) Expression level of Smpd1 (o), Smpd2 (p), Alix (p), Tsg101 (r) and Stam1 (s) in BMDMs from Smpd3Mye‐WT (n = 4–5) versus Smpd3Mye‐KO mice (n = 5–6). Results are represented relative to Smpd3Mye‐WT. Data are represented as means ± SEM. Statistical analyses were performed by unpaired t‐testing (*p < 0.05, ****p < 0.0001; ns, not significant). Alix, apoptosis linked gene 2 interacting protein X; BMDM, bone marrow‐derived macrophage; EV, extracellular vesicle; Smpd, sphingomyelin phosphodiesterase.
