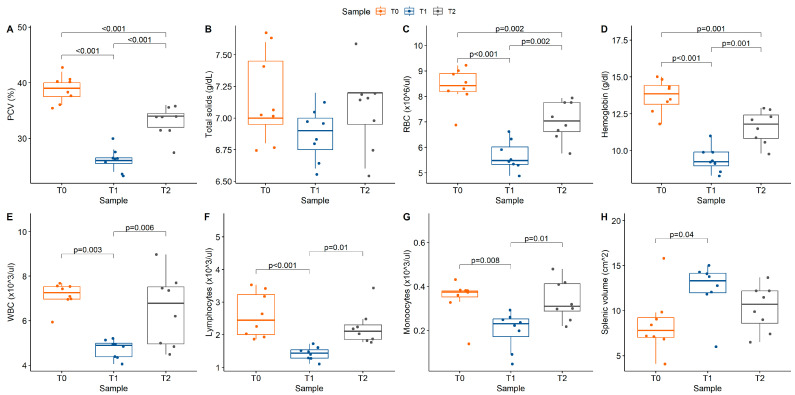
Figure 2.
Box plots with overlaid scatter illustrating hematologic parameters of interest: (A) packed cell volume (PCV), p < 0.001; (B) total solids (TS), p = 0.15; (C) red blood cell count (RBC), p < 0.001; (D) hemoglobin, p < 0.001; (E) white blood cell count (WBC), p = < 0.001; (F) lymphocytes, p < 0.001; (G) monocytes, p = 0.005; (H) modified splenic volume, p = 0.045. Color reflects study time points (T0 = baseline, T1 = 1 h post acepromazine, T2 = 12 h post acepromazine). Values above brackets reflect significance of between-group comparisons.

