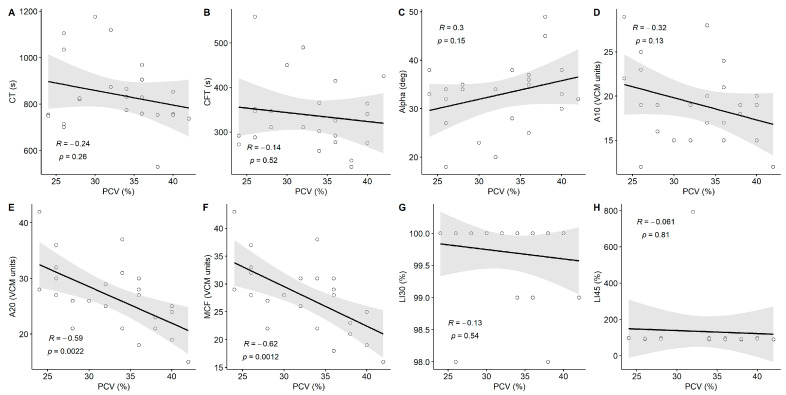
Figure 5.
Scatter plot of viscoelastic coagulation parameters vs. packed cell volume (PCV) over the entire study. (A) CT, (B) CFT, (C) alpha, (D) A10, (E) A20, (F) MCF, (G) LI30, and (H) LI45. Lines and gray shaded area represent results of Pearson’s correlation analysis with 95% confidence intervals, respectively.

