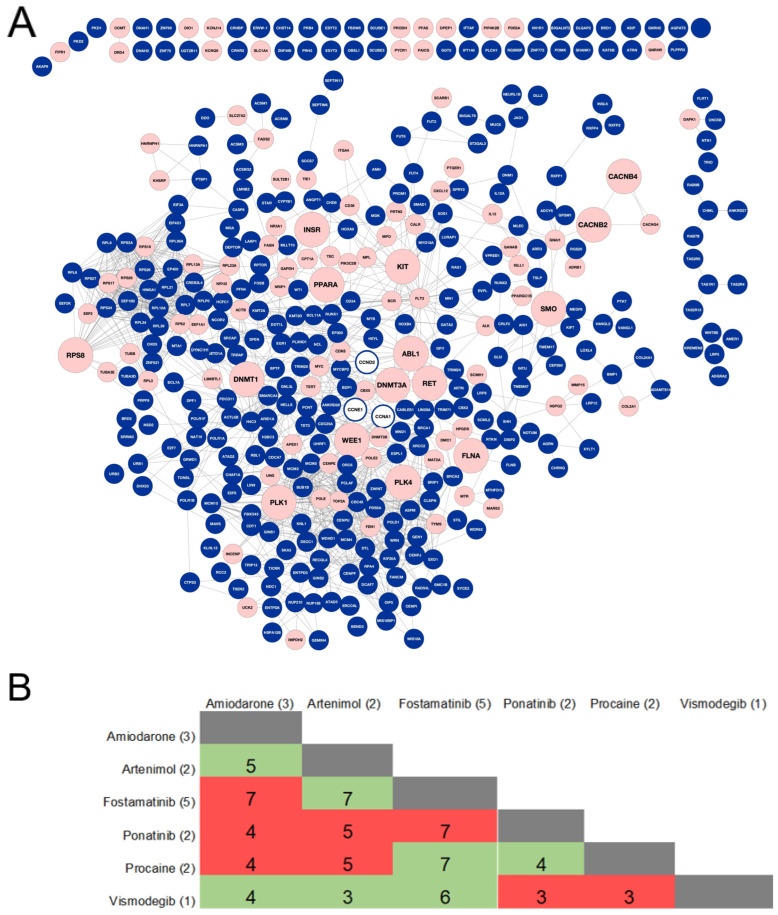
Figure 2.
Overview of the druggable (light red) versus undruggable (blue) components of the AML network. (A) The nodes represent proteins, and the connecting lines (edges) indicate functional associations. The fifteen selected target proteins are represented by bigger nodes. The three cyclin proteins that were selected for subsequent de novo multi-target drug design are denoted by a blue outline. (B) Diagram of the permissible two-drug combinations that can target the highest number of druggable hubs. The safe combinations appear in green, while those that are associated with drug–drug interactions are in red. The number of the AML network hubs targeted by each drug alone is depicted next to each drug name. The number of the targeted hubs for each drug combination is outlined in the corresponding cell.

