Figure 3.
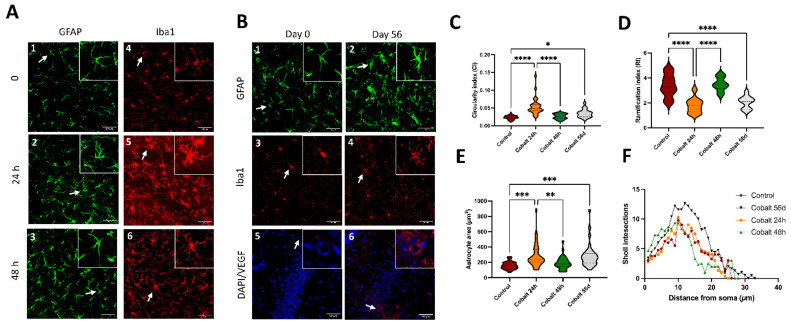
Morphometric analysis of microglial and astrocytic activation following cobalt exposure (A–F). (A1–A6) Increased immunoreactivity of Iba-positive microglia and GFAP-positive astrocytes was evident during the first 24 h after a single high-dose injection of cobalt and subsided by 48 h. (B1–B4). Low levels of Iba and GFAP immunoreactivity after 56 days of daily low-dose cobalt administration. (C) Swarm plot showing circularity index of the experimental groups. (D) Swarm plot showing ramification index of the experimental groups. (E) Swarm plot showing astrocytic cover area in the experimental groups. (F) Distinct difference between control and low-dose-cobalt-treated group (* p < 0.05) in Sholl intersection distribution by distance from the astrocyte’s soma. The analyses (C–F) were performed by one–way ANOVA with Tukey’s multiple comparison tests. Each group contained 5 mice (n = 5); for each mouse, twenty to thirty cells per region were analyzed. (B5,B6) Increased VEGF immunoreactivity, particularly localized around blood vessels, in the cobalt-treated group versus the control group; * p < 0.05, ** p < 0.01, *** p < 0.001, **** p < 0.0001.

