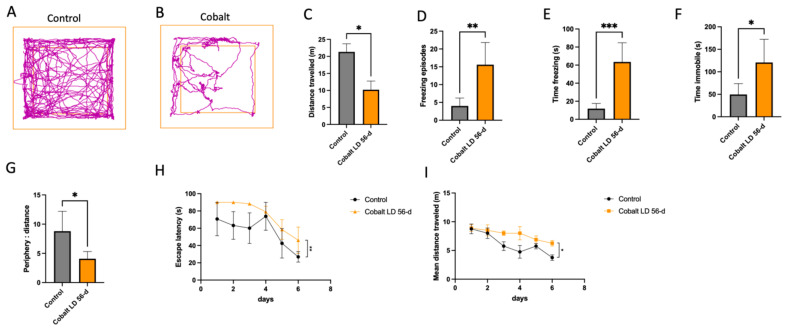
Figure 4.
Behavioral assessment of cobalt-induced effects on locomotion and anxiety. (A–G). (A,B) Representative OFT track plot recorded during the 5-min test sessions (ANY-maze). The central square was designated the “central zone”, and the periphery, the “border zone”. (C–G) Locomotor activity decreased after chronic cobalt treatment, whereas anxiety-related behavior was increased. * p < 0.05, ** p < 0.01, Student t-test. (H,I) MWM spatial acquisition learning curves after 6 consecutive days. Data points represent mean values of escape latency of the control (black) and the cobalt-injected (orange) groups (H). The between-group difference was statistically significant. (I) Mean distance traveled in meters until island zone entry as a function of the day of training. The day of training had a significant influence on the mean distance traveled in both groups (p < 0.05). * p < 0.05, ** p < 0.01, *** p < 0.001 Student t-test. Number of mice: n = 5 in each group. Data shown are mean ± SEM. LD = low dose.

