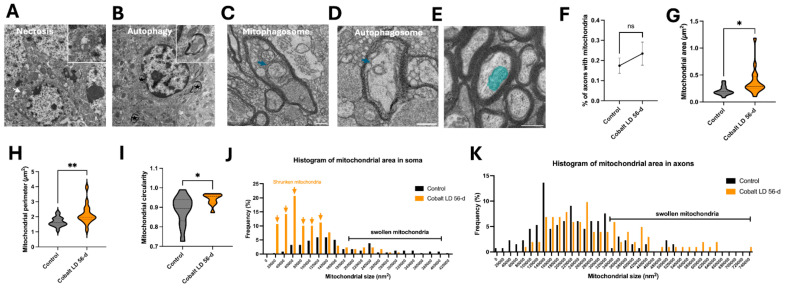
Figure 7.
Cobalt-induced neuronal death mechanisms: necrosis, autophagy, and mitochondrial alterations. (A) Necrotic neuronal cell body showing the absence of a defined nuclear membrane, enlarged mitochondria (white arrow), and altered chromatin organization after 56 days of daily cobalt exposure. The inset presents a high-resolution image of the swollen mitochondria. (B) Autophagic activity observed in neuronal cell bodies at 56 days after cobalt treatment, with autophagosomes marked by asterisks. The inset provides a detailed view of an autophagosome. (C,D) An example of a small, degraded mitochondrion within a mitophagosome and the formation of autophagosomes (blue arrows) in an axon from a cobalt-treated mouse. Scale bar: 0.5 µm. (E) Cross-sectional view of a myelinated axon with mitochondria (blue) in a control mouse; scale bar: 0.5 µm. (F) Percentage comparison of myelinated axons containing mitochondria between cobalt-exposed and control mice. (G–I) Cross-sectional analysis of mitochondrial size (G), perimeter (H), and circularity (I) in axons. Violin plots show the full distribution of measurements. * p < 0.05, ** p < 0.01, NS (not significant); Student’s t-test. A total of 300 mitochondria were analyzed in each group, with data expressed as mean ± SEM. (J,K) Frequency distribution of mitochondrial area in neuronal cell bodies (J) and axons (K) between control and cobalt-exposed groups following two months of daily treatment. Arrows indicate a higher occurrence of shrunken mitochondria. Number of mitochondria analyzed: n = 300 per group.

