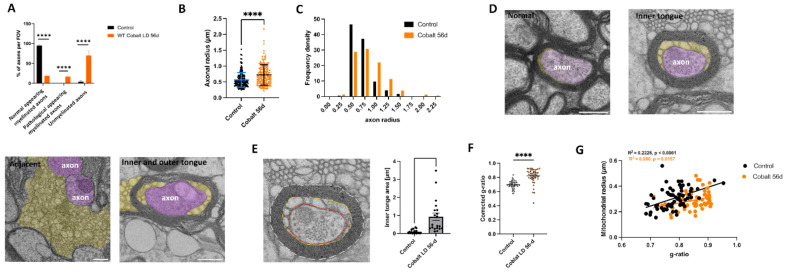
Figure 8.
Phenotypic quantification of optic nerve alterations following cobalt treatment. (A) Analysis was performed on optic nerve cross-sections on a total area of >320 µm2 with >200 axons per group; all the axons in the field of view were counted. **** p < 0.001, unpaired t-test. (B) Plot showing increased axonal radius in the cobalt-treated group compared to controls. **** p < 0.0001, unpaired t-test. (C) Histogram showing axonal radius density. (D) Electron micrograph of optic nerves showing myelin pathology. Membrane tubules (orange) emerge at the inner tongue of the cobalt-treated mice. Occasionally, tubulations (purple) are seen at the outer tongue of myelinated axons associated with tubulations at the inner tongue. At places where most compact myelin is lost, membrane tubules loop out and leave partially demyelinated axons behind. Tubules could also be found next to demyelinated axons. (E) Illustration of corrected g-ratio measurement. Three lines are drawn for the area measurement: the outline of the fiber (stippled white line), the outline of the inner border of the compact myelin (orange), and the axon (red). Scale bar = 500 nm. The inner tongue area was increased in the low-dose-cobalt-treated group compared to the control. (F) Corrected g-ratio measurements reveal a progressive decrease in compact myelin in the cobalt-treated group compared to controls. Number of mice: n = 5, >20 axons each. **** p < 0.0001, unpaired t-test. (G) Scatter plot illustrating the relationship between the mitochondrial radius and the g-ratio. Pearson’s r test.

