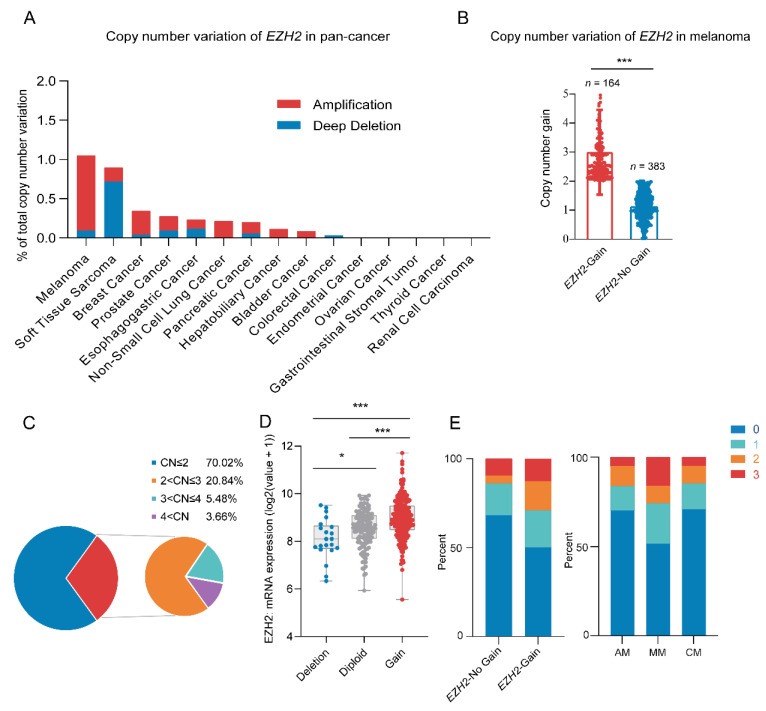
Figure 1.
Copy number variation of EZH2 gene in melanoma. (A) EZH2 gain status in different cancer types from the cBioPortal database. (B) Copy number variation of EZH2 gene in 547 melanoma samples. *** p < 0.001. (C) Distribution pie chart of EZH2 copy number (n = 547). According to the EZH2 copy number, it is divided into four subgroups. Subgroup 1: copy number ≤ 2; subgroup 2: 2 < copy number ≤ 3; subgroup 3: 3 < copy number ≤ 4; subgroup 4: copy number > 4. (D) Correlation of EZH2 gain status with its mRNA expression in melanoma samples from the cBioPortal database (n = 367). * p < 0.05, *** p < 0.001. (E) Association of EZH2 copy number gain with expression levels in melanoma subtypes (n = 183). The left panel represents the percentage of cases with or without EZH2 copy number gain across different expression levels (0, 1, 2, 3). The right panel illustrates the proportion of expression levels in different melanoma subtypes: acral melanoma (AM), mucosal melanoma (MM), and cutaneous melanoma (CM). The staining score for each sample, counting the intensity of the staining, was graded as 0, 1, 2, and 3 (“0” as negative, and “3” as the strongest).

