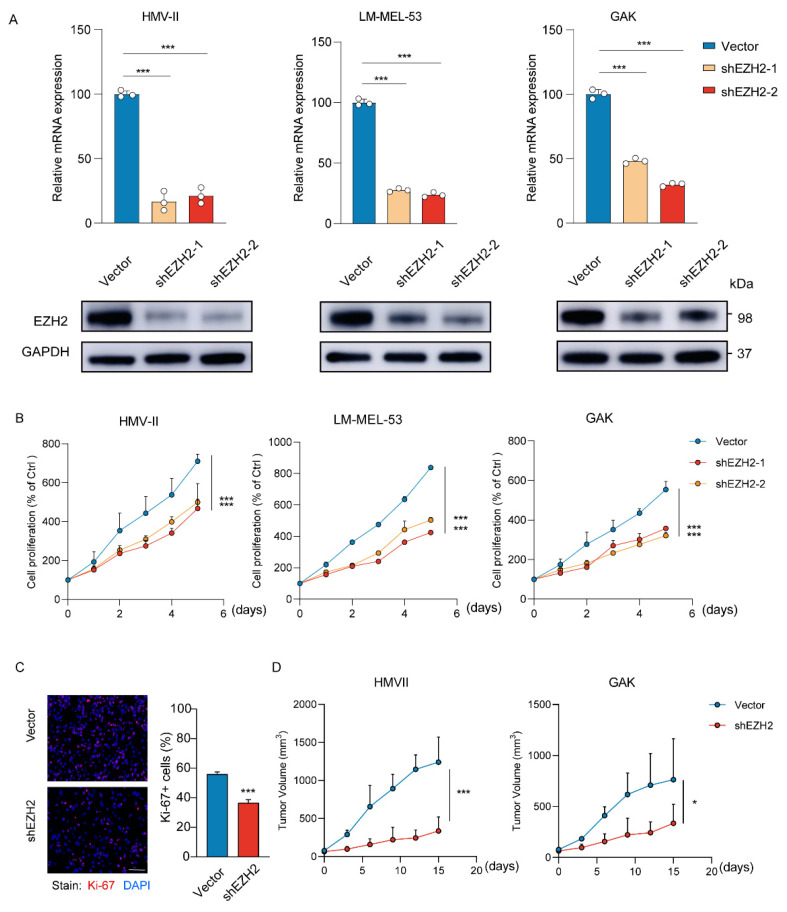
Figure 3.
Loss of EZH2 inhibits MM cell proliferation and progression in vitro and in vivo. (A) The expression of EZH2 was detected by RT-qPCR (top row) or Western blot assay (bottom row) after the knockdown of EZH2. The data are presented as the mean ± SEM. n = 3, *** p < 0.001. (B) HMV-II, LM-MEL-53, and GAK cells with stable depletion of EZH2 or control were grown for 5 days, with cell numbers counted every day by CCK-8 assays. The changes in cell numbers were compared to day 0, and the mean ± SEM from 3 experiments was plotted. *** p < 0.001. (C) The proliferative abilities of stably EZH2-depleted HMVII cells were measured with Ki-67 staining assay. Three experiments were conducted with mean ± SEM of percentage of Ki-67-positive cells plotted. Scale bar: 100 μm. *** p < 0.001. (D) The average sizes of xenograft tumors were measured every 3 days and plotted (n = 5, error bars indicate mean ± SEM). * p < 0.05, *** p < 0.001.

