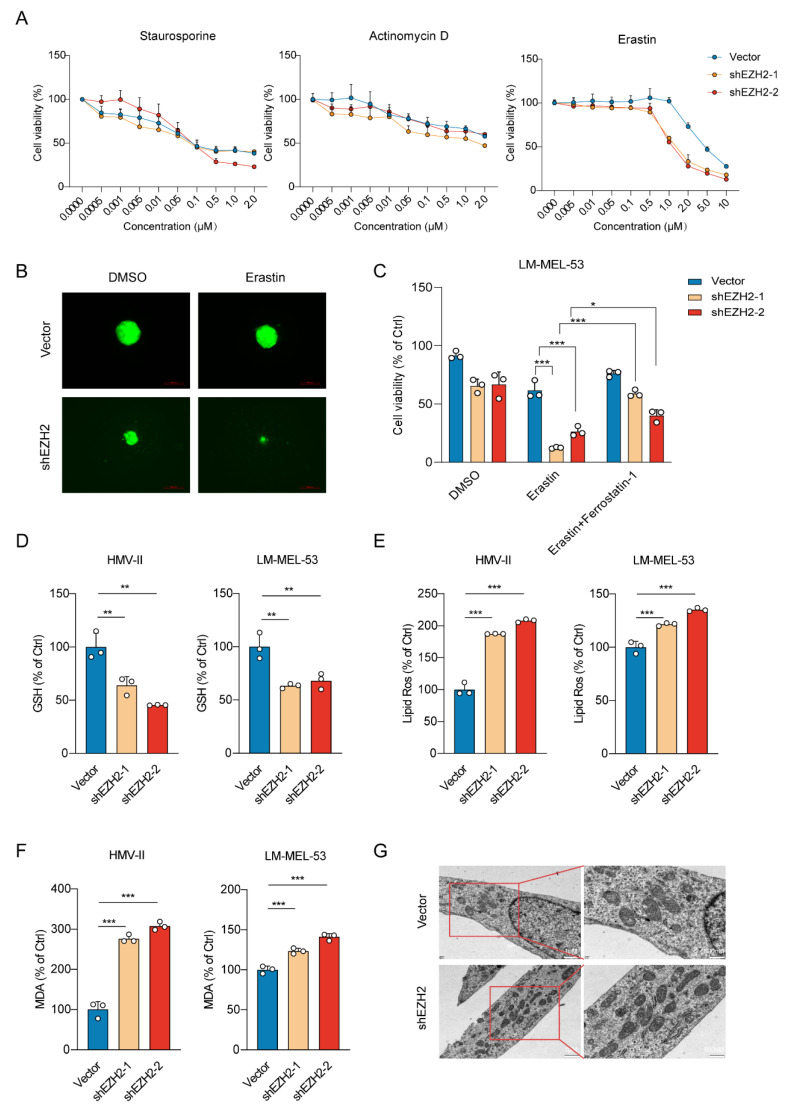
Figure 4.
EZH2 knockdown enhances ferroptotic sensitivity in MM cells. (A) Cell viability response to treatment with apoptosis and ferroptosis inducers in cells with EZH2 knockdown. Cell viability was assessed after treatment with a range of concentrations of apoptosis inducer staurosporine (left panel), apoptosis inducer actinomycin D (middle panel), and ferroptosis inducer erastin (right panel). The mean ± SEM from 3 experiments was plotted. (B) Representative images of EZH2 knockdown effects on the viability of 3D spheroids formed by LM-MEL-53 cells in response to 4 µM erastin, as indicated by GFP fluorescence. Scale bars: 200 µm. (C) Bar graph showing viability of LM-MEL-53 cells with EZH2 knockdown, treated with 4 µM erastin or 4 µM erastin and 4 µM Ferrostatin-1. The data are presented as the mean ± SEM. n = 3, * p < 0.05, *** p < 0.001. (D) Bar graph demonstrating intracellular glutathione levels in EZH2-depleted HMV-II and LM-MEL-53 cells. The data are presented as the mean ± SEM. n = 3, ** p < 0.01. (E) Lipid peroxidation was measured by flow cytometry after 5 μM CellROX Deep Red staining in EZH2-depleted cells. The data are presented as the mean ± SEM. n = 3, *** p < 0.001. (F) The level of malondialdehyde in cells was determined by using a malondialdehyde kit after the knockdown of EZH2. The data are presented as the mean ± SEM. n = 3, *** p < 0.001. (G) TEM was used to detect the mitochondrial morphology of ferroptotic cells. Scale bars: 1 μm (left column), and 500 nm (right column).

