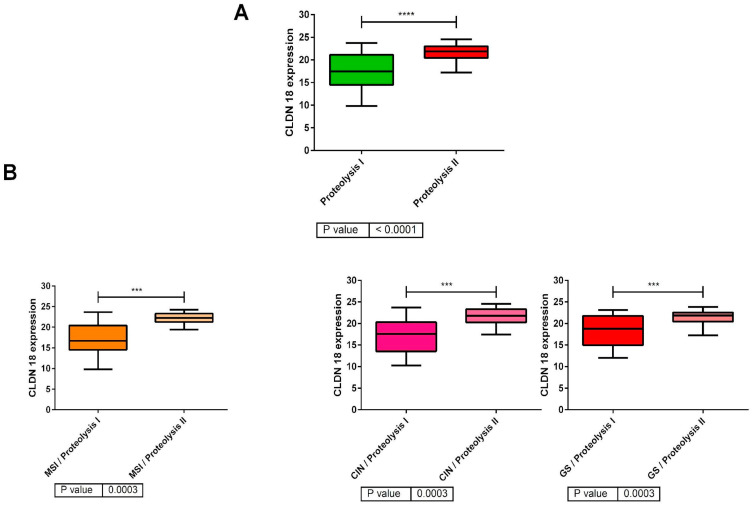
Figure 4.
(A) Division of patients into low-claudin-18 and high-claudin-18 expression groups within the proteolysis layer (79 samples in Cluster 1 and 63 samples in Cluster 2). (B): Claudin-18 expression across the TCGA molecular subtypes (CIN, MSI, and GS) whose distribution according to the proteolysis layer is included in Table 2. ****: p < 0.0001; ***: p < 0.001.

