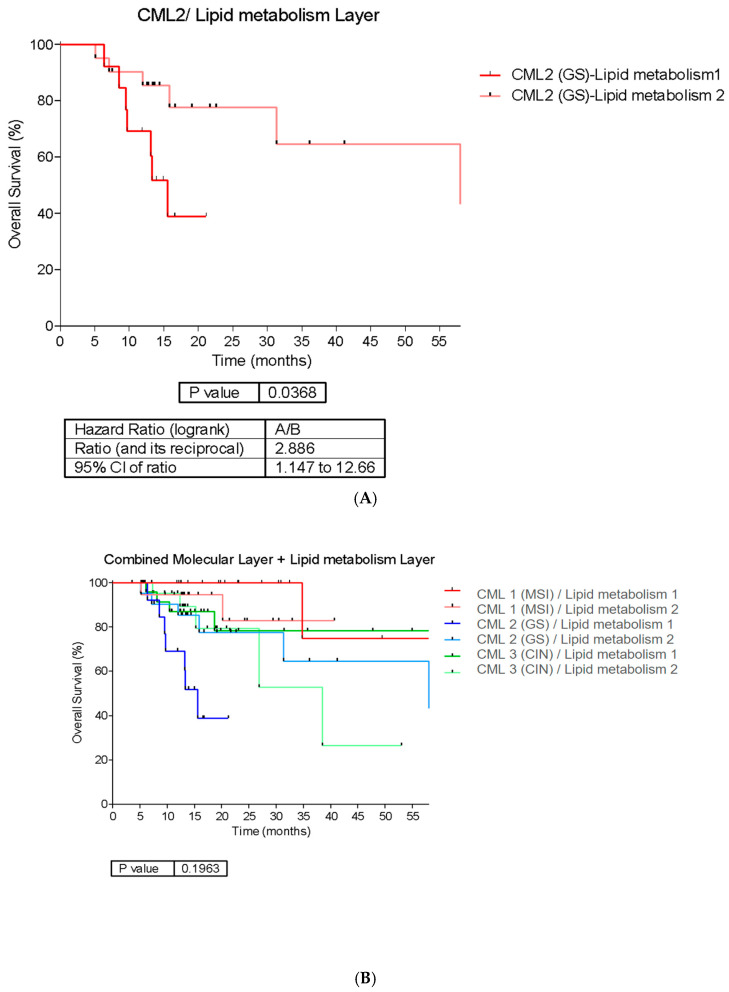
Figure 5.
(A) Overall survival curves of patients classified into CML2 (aligned to GS tumors as shown in Figure 2B) with further stratification into Lipid Metabolism Cluster 1 and Lipid Metabolism Cluster 2. CML 2-Lipid Metabolism Cluster 2 exhibited higher median OS than Cluster 1. (B) Survival curves for the TCGA subtypes (MSI, GS, and CIN, corresponding to CML 1, CML 2, and CML 3, respectively, as shown in Figure 2B) stratified further by whether they belong to Cluster 1 or 2 of the lipid metabolism layer.

