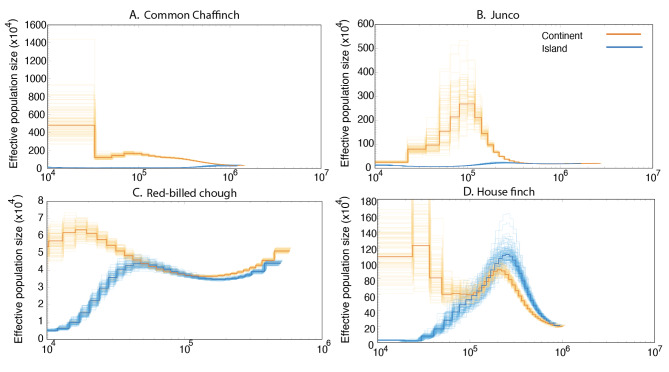
Fig. 3.
Demographic history of insular and mainland populations. The analysis was performed using Pairwise Sequentially Markovian Coalescent (PSMC). Demographic inference for one individual per treatment and species, with the orange and blue dark lines corresponding to the continental and insular populations, respectively. Shown are PSMC plots for A) Common Chaffinch, B) Junco, C) Red-billed Chough and D) House Finch. The lighter orange and blue lines represent 100 bootstrap replicates. The point where both lines depart from each other corresponds to the time of colonization, which is around 40,000 y for the Red-billed Chough, 900,000 y for the Common Chaffinch, 100,000 y for the House Finch and 400,000 y for the Dark-eyed Junco. The mutation rate used was of 4.6e-9 mutation/site/generation for all species, and the generation time used in all cases was two years. See Fig. S2 for bootstrapped versions of the individual PSMC plots. See Fig. S3 for PSMC plots with generation time of one year for the Common Chaffinch, Dark-eyed Junco and House Finch and three years for the Red-billed Chough

