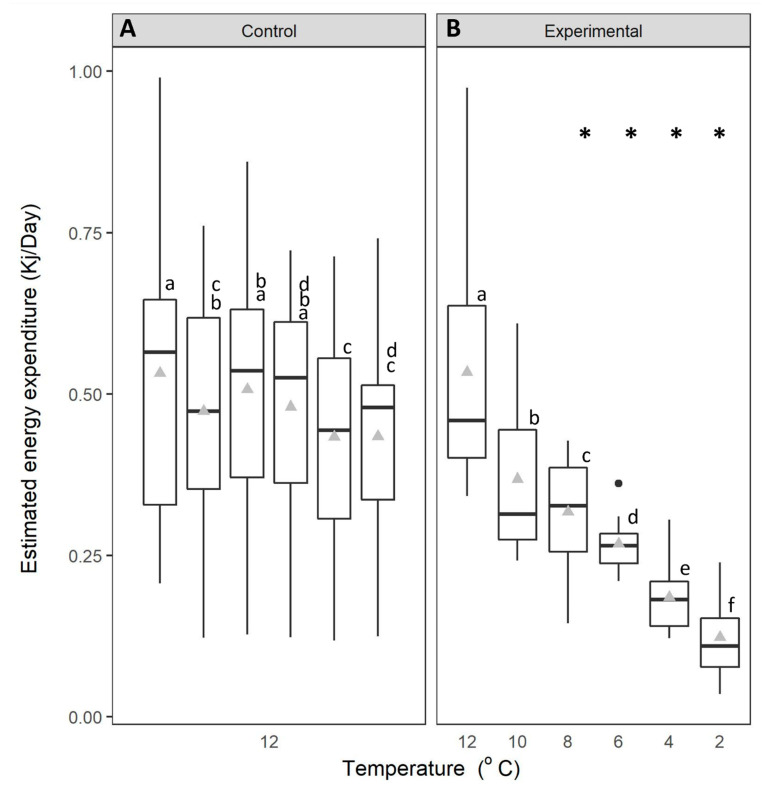
Figure 3.
Estimated energy expenditure (kJ/day) of green crabs. (A): control crabs, held at 12 °C and (B): experimental crabs, experiencing a reduction in temperature from 12 °C to 2 °C. The data are displayed for each 24-h period over 6 days. Whiskers represent 95% confidence limits, boxes show upper and lower quartiles, horizontal bar presents median values, black circles denote outlying values and grey triangles denote mean. * denotes where we observed significant differences in temperature treatment relative to the control. Lowercase letters (above each bar) denote significant differences within treatment groups, like letters are not significantly different from one another.

