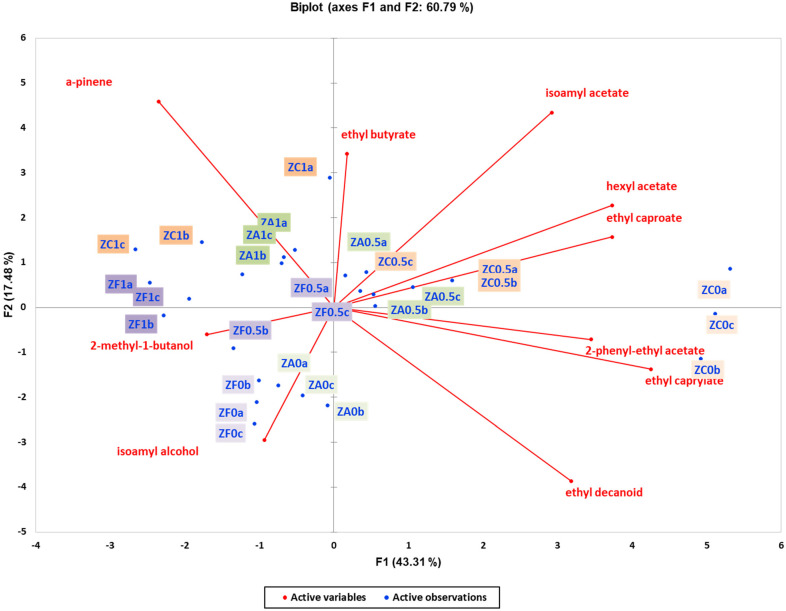
Figure 5.
Unsupervised classification using principal component analysis on metabolomic data (volatile compounds) from the experimental wines produced by the ZymafloreX5 yeast. Letters of the samples in the Biplot indicate the ID: Z—ZymafloreX5, F—French oak, A—American oak, C—control (no oak), 0—no resin, 0.5—0.5 g/L resin, 1—1 g/L resin, a; b; c—replication. Samples in the score plots were coloured according to the resin treatments (0, 0.5, and 1 g/L) and oak treatment (no oak—orange, French oak—purple, American oak—green). Sequential increase in the resin concentration is presented with darker colours (0 g/L resin—pale, 0.5 g/L— medium dark, and 1 g/L—dark).

