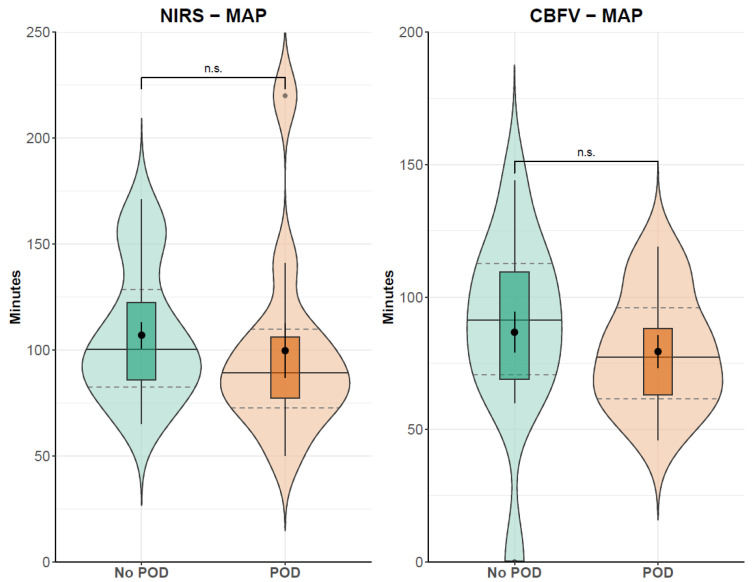
Figure 3.
Absolute time of cerebral autoregulation indices above 0.3, indicating impaired cerebral autoregulation. Indices are derived from moving linear correlations between MAP and cerebral parameters. CBFV: (middle) cerebral artery mean blood flow velocity; MAP: mean arterial pressure; POD: postoperative delirium; rSO2: regional cerebral oxygen saturation. Median (solid lines) and interquartile range (dashed lines); n.s. = not significant (according to results from Mann–Whitney U test).

