Fig. 2.
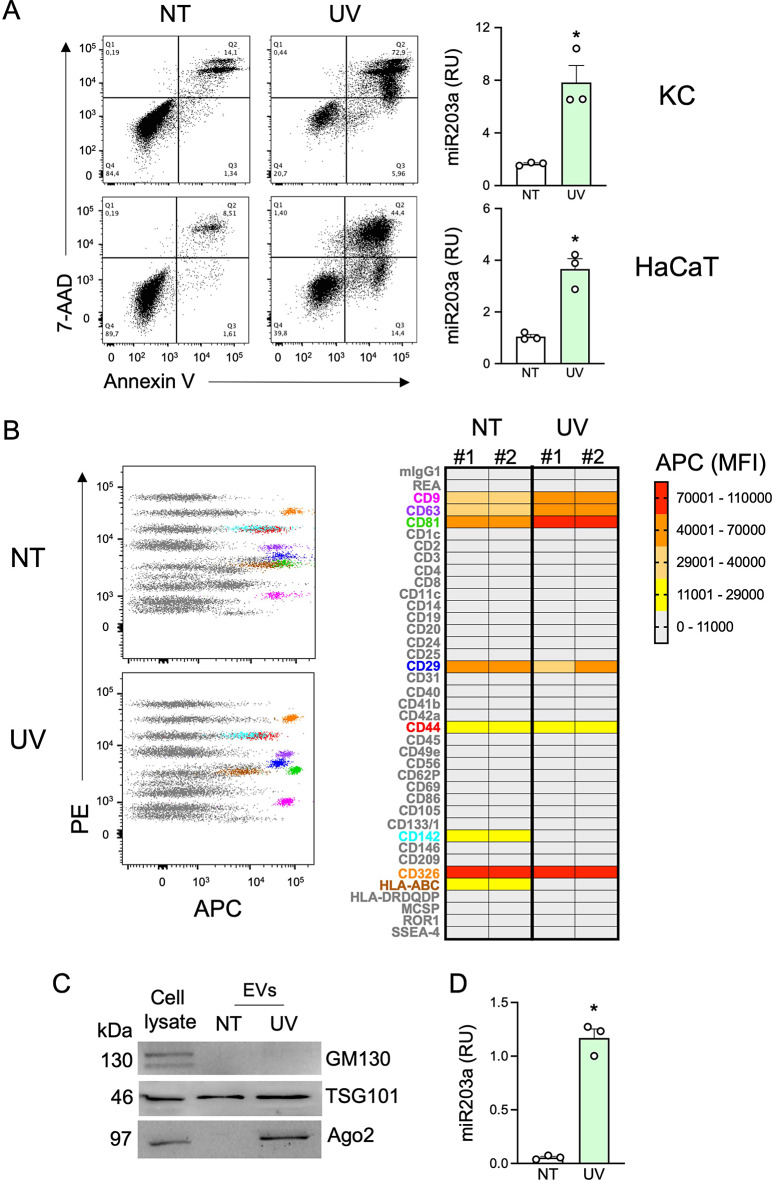
sEVs derived from conditioned media of UV-treated HaCaT cells are enriched in Ago2 protein. (A) KC and HaCaT cells were UV irradiated and cell death was investigated by flow cytometry (left panels). miR203a expression in cell-free supernatants was assessed by qPCR (right panels). Data are expressed as mean ± SEM of Relative Units (RU) compared to UniSp4 RNA; *P < 0.05 vs. “NT” by paired Student’s t test. (B) sEV surface proteins were analysed by multiplex bead-based flow cytometry. PE channel vs. APC-stained channel dot plots (B, left panels) display the signal of single bead types. The bead populations with the brightest staining are colored. (B, right panel) Heatmap of the Median Fluorescence Intensity (MFI) of the APC channel for all 39 bead populations after subtraction of background signal (medium alone) in 2 independent sEV preparations. Markers called present are highlighted with the same colors as in dot plots. (C) Western blot analysis was performed on HaCaT cell lysates (10 µg) or on equal volumes of NT-sEVs and UV-sEVs. One representative experiment out of 3 is shown. (D) miR203a expression in NT-sEVs or UV-sEVs was evaluated by qPCR. Data are expressed as mean ± SEM of Relative Units (RU) compared to UniSp4 RNA; *P < 0.05 vs. “NT” by paired Student’s t test

