Fig. 3.
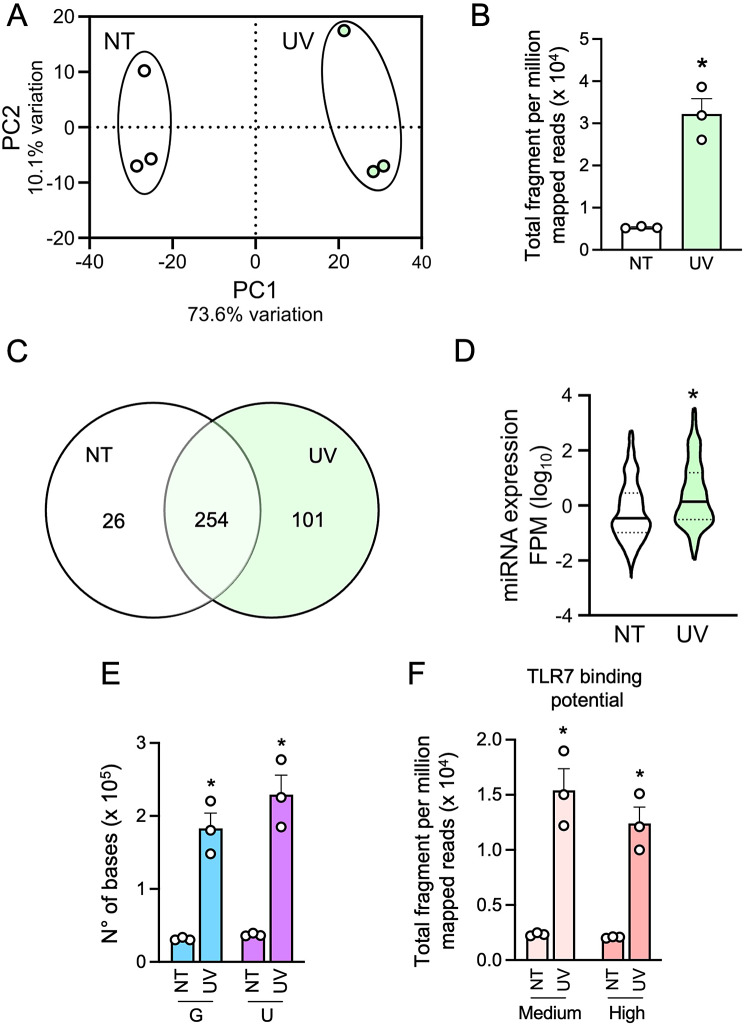
UV-sEVs contain more miRNAs as compared to NT-sEVs and display a higher TLR7-activating potential. (A) PCA scatterplot based on the variance stabilized counts of mature miRNAs identified in smallRNA-seq data of NT-sEVs (“NT”) and UV-sEVs (“UV”) (n = 3). (B) Total fragment per million mapped reads (FPM) in NT-sEVs and UV-sEVs. Data are expressed as mean ± SEM (n = 3); *P < 0.05 vs. “NT” by paired Student’s t test. (C) Venn diagram of number of miRNAs expressed in NT-sEVs and UV-sEVs as obtained from smallRNA-seq analysis. (D) Violin plot of the expression levels of miRNAs present either in NT-sEVs and UV-sEVs. For each miRNA the FPM value of 3 experiments was plotted. Data are shown as log10 (FPM). (E) G and U content was determined for each miRNA in NT-sEVs and UV-sEVs and adjusted for its expression (FPM). Data are expressed as mean ± SEM (n = 3); *P < 0.05 vs. “NT” by paired Student’s t test. (F) miRNAs were characterized as “high TLR7 binding” if containing at least one UUU/UUC triplet or “medium TLR7 binding” if containing at least one UUA/UUG triplet (medium binding potential) and represented with their respective levels of expression (FPM). Data are expressed as mean ± SEM (n = 3); *P < 0.05 vs. “NT” by paired Student’s t test

