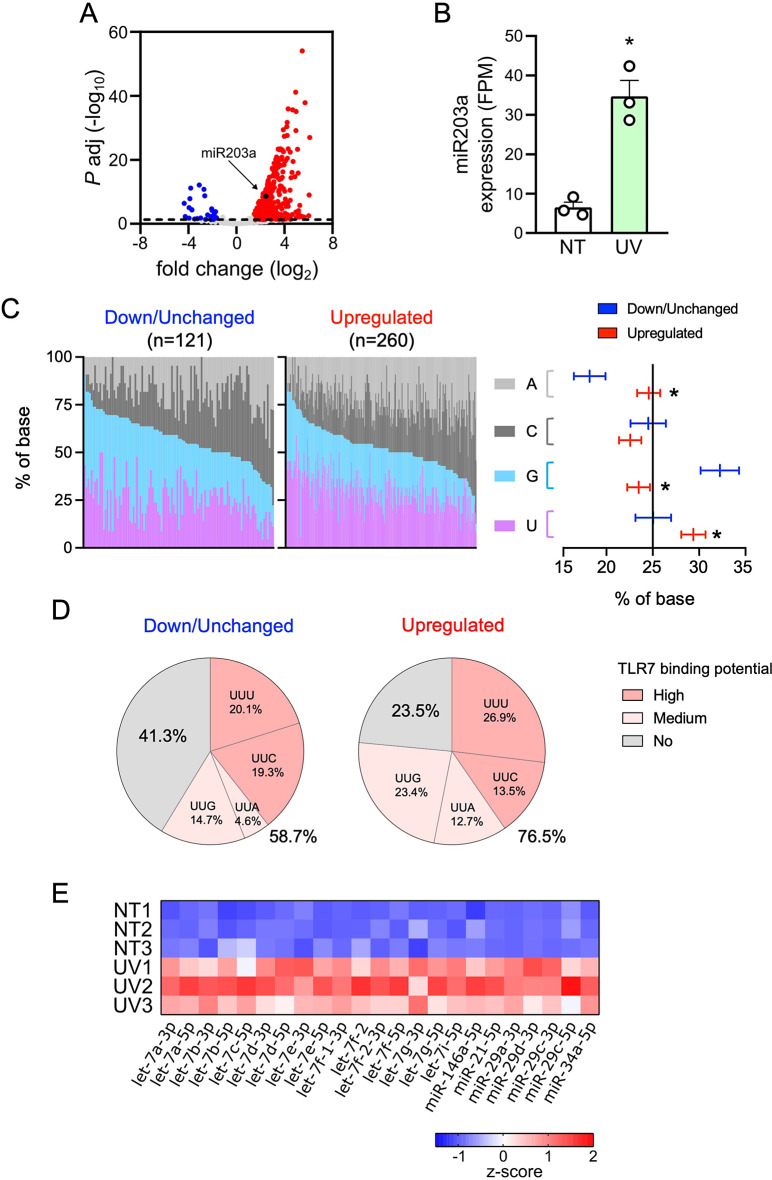
Fig. 4.
Most miRNAs are upregulated in UV-sEVs and are enriched in TLR7-activating moieties. (A) Volcano plot of differentially expressed miRNAs in NT-sEVs and UV-sEVs. For each miRNA, the log2 (fold change, x-axis) and the -log10 (adjusted p-value, y-axis) are shown. Dashed line shows the 0.05 boundary for adjusted p-value. Red dots: upregulated miRNAs (log2(fold change) > 1.5, adjusted p-value < 0.05; blue dots: downregulated miRNAs (log2(fold change) < -1.5, adjusted p-value < 0.05; grey dots: not differentially expressed miRNAs. Black dot highlights miR203a (B) miR203a expression levels in NT-sEVs (“NT”) and UV-sEVs (“UV”) as obtained from smallRNA-seq data. miR203a expression is reported as FPM (mean ± SEM, n = 3); *P < 0.05 vs. “NT” according to the Wald test implemented in DESeq2. (C, left panel) Base composition (%, colors as indicated in figure) of each down/unchanged or upregulated UV-sEV miRNA is represented. miRNAs were ordered based on decreasing contents of G + U. (C, right panel) Confidence level of the percentage of the base composition of down/unchanged or upregulated miRNAs is represented. Base proportions were modelled using a multinomial regression. Post-hoc contrasts p-values were adjusted using Holm procedure; *P < 0.05 vs. “NT”. (D) Pie charts representing the significantly different mean proportions of TLR7-binding miRNAs in down/unchanged or upregulated UV-sEVs. The distribution of TLR7 high, medium and no binding sequences between down/unchanged and upregulated was compared sing a multinomial logistic regression model and tested using a likelihood ratio test (LRT, p = 0.00055). (E) Heatmap of the modulation of miRNAs previously demonstrated to activate TLRs in UV-sEVs as compared to NT-sEVs. Data are shown as z-score transformed FPM

