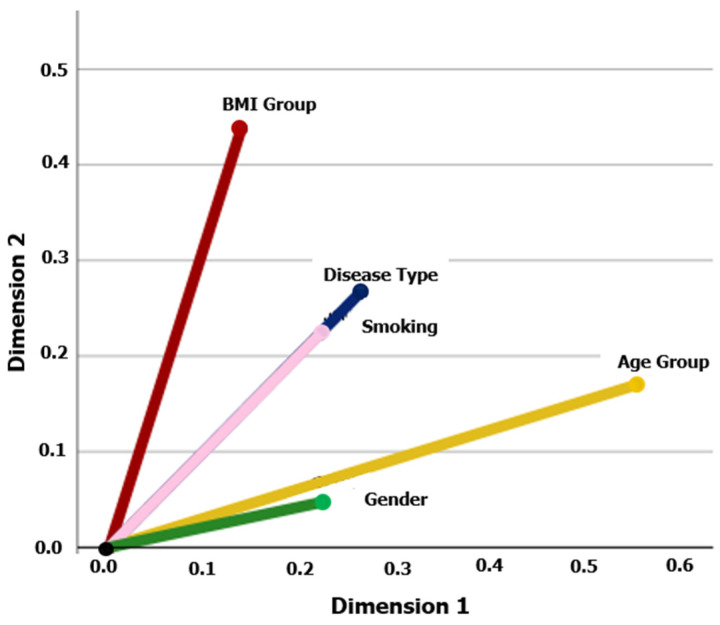
Figure 8.
Multiple correspondence analysis of the patients’ characteristics. The analysis was performed for the following patients’ features: disease type (SMM, MGUS), gender, age group (<65, ≥65), smoking, and BMI group (<25, ≥25). The cosine of the angle between two vector lines represents the association between the corresponding variables. If two vector lines are close together, it suggests that the categories they represent are similar or positively associated. Conversely, if they are far apart, it indicates dissimilarity or a negative association. A 90° angle indicates that the variables are not related.

