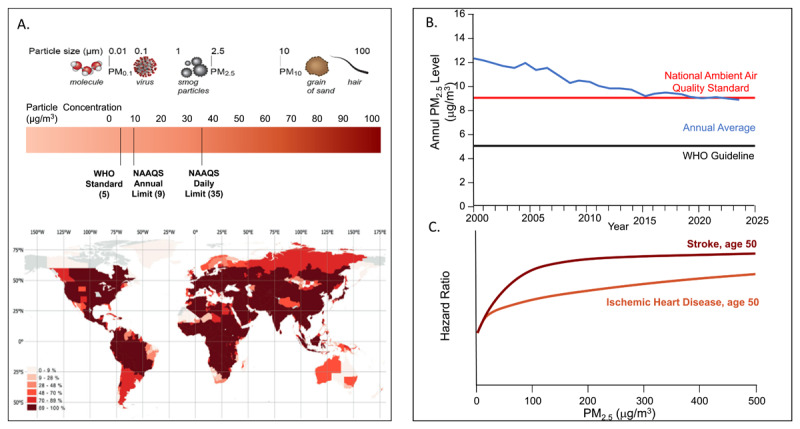
Figure 1.

(A) Particulate matter components, sizes, and standards. NAAQS: National Ambient Air Quality Standards; WHO: World Health Organization. Map of percentage of the population exposed to PM2.5 over 5 μg/m across the world. Used with permission from Nat Commun. 2023 Jul 22;14(1):4432.4 (B) Annual average PM2.5 concentrations in the United States with an increase in 2017 and 2018 and subsequent flattening attributable to wildfires. (C) Shape of the exposure–response relationships between PM2.5 air pollution (annual average) and cardiovascular disease across the full range of global exposures, modeled for a 50-year-old person. The response function represents a meta-regressed Bayesian, regularized, trimmed (MR-BRT) curve derived by relaxing the log-linear assumption with the use of cubic splines. Data is derived from Global Burden of Disease. Lancet. 2020 Oct 17;396(10258):1223-1249.
