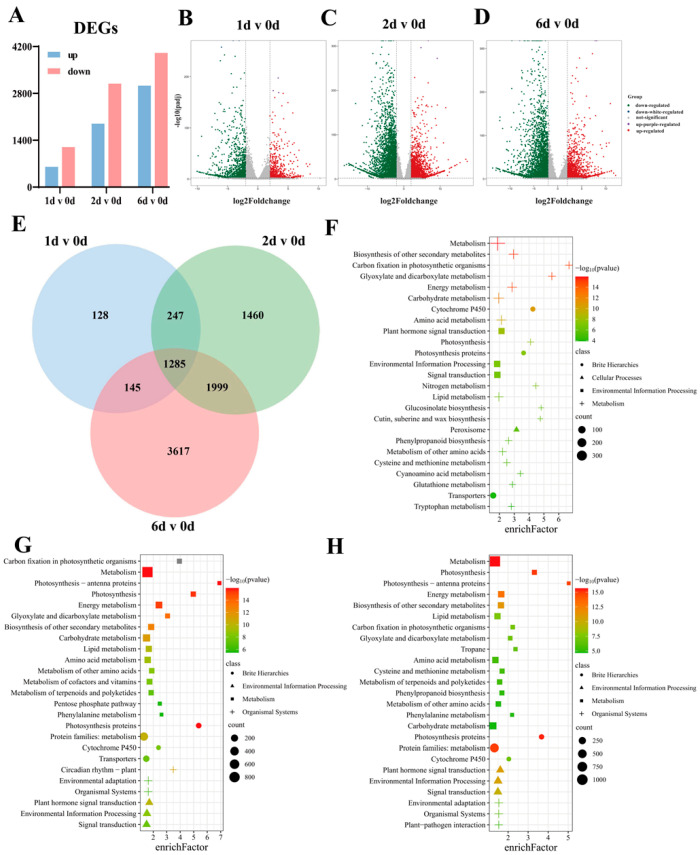
Figure 3.
Identification and functional annotation of DEGs in different developmental stages of pak choi sprouts. (A) Differentially expressed genes (DEGs) analysis between different groups; (B) Volcano map of DEGs between 1 d and 0 d groups; (C) Volcano map of DEGs between 2 d and 0 d groups; (D) Volcano map of DEGs between 6 d and 0 d groups; (E) Common and specific DEGs between three groups; (F) KEGG pathway enrichment analysis of the DEGs between 1 d and 0 d groups; (G) KEGG pathway enrichment analysis of the DEGs between 2 d and 0 d groups; (H) KEGG pathway enrichment analysis of the DEGs between 6 d and 0 d groups. The screening conditions for DEGs were |log2Foldchange| ≥ 2 and p-value ≤ 0.01, enrichFactor: the number of DEGs in a term/the number of all DEGs.

