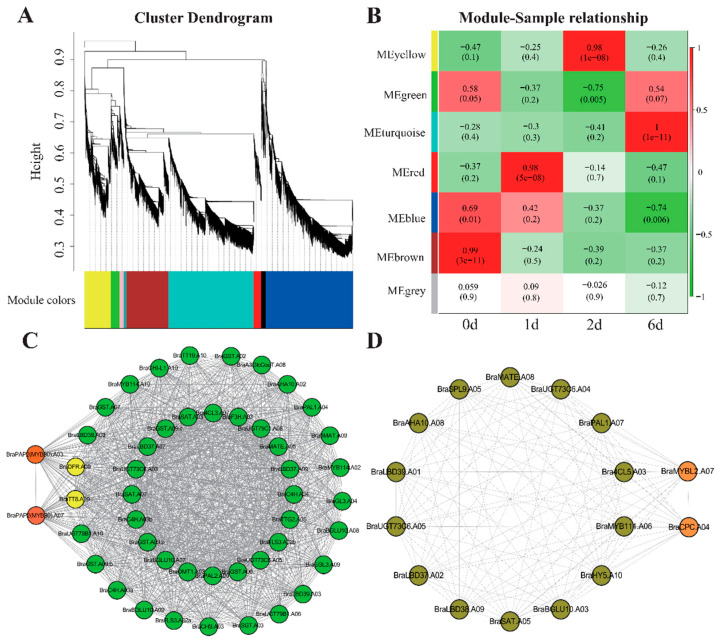
Figure 5.
Weighted gene co-expression network analysis of DEGs in different developmental stages of pak choi sprouts. (A) Cluster dendrogram constructed by WGCNA showing seven co-expressed gene modules, the co-expression modules are depicted in different colours, while grey modules indicate no correlation between genes; (B) Module–sample relationship of seven modules, correlation analysis was performed between the co-expression modules of various genes in different developmental stages, the numbers above the heat map indicate the Person correlation coefficient (r) values; (C) Cytoscape representation of co-expressed anthocyanin metabolism-related genes in the MEbrown module; (D) Cytoscape representation of co-expressed anthocyanin metabolism-related genes in the MEturquoise module.

