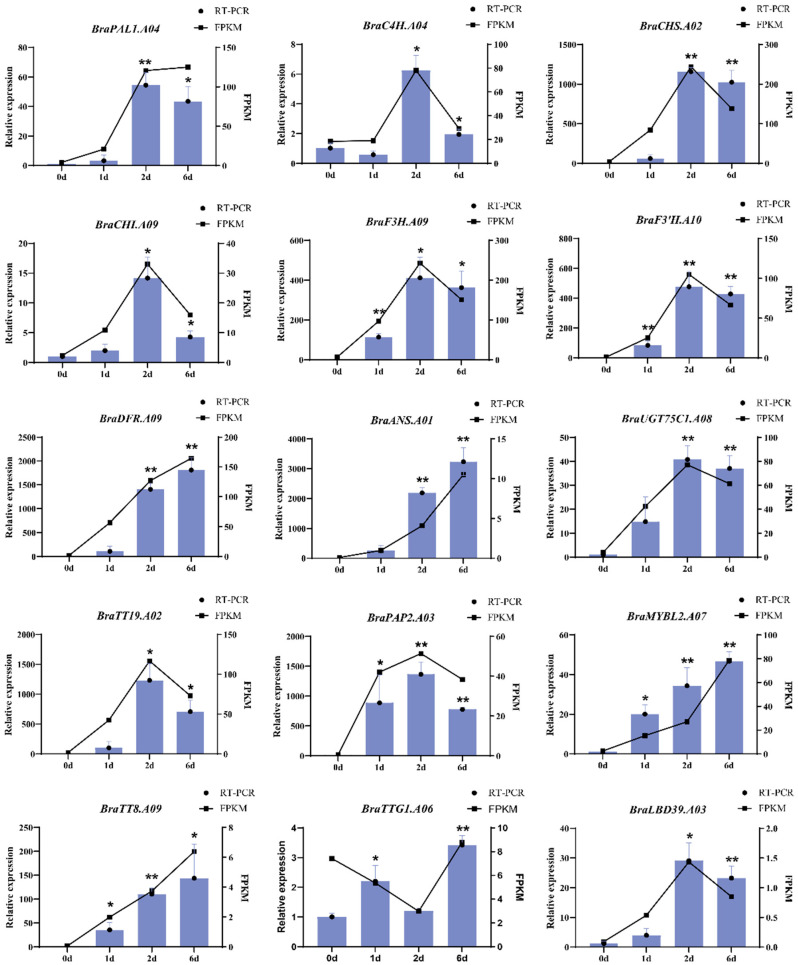
Figure 6.
qRT-PCR analysis of expression patterns of anthocyanin biosynthesis-related genes in different developmental stages of pak choi sprouts. Both white and purple flower samples were utilised (with three biological replicates) for the analysis. Data points represent the mean value of three technical replicates in a representative biological experiment. Error bars indicate the standard deviation, student’s t-test, ** p < 0.01, * p < 0.05.

