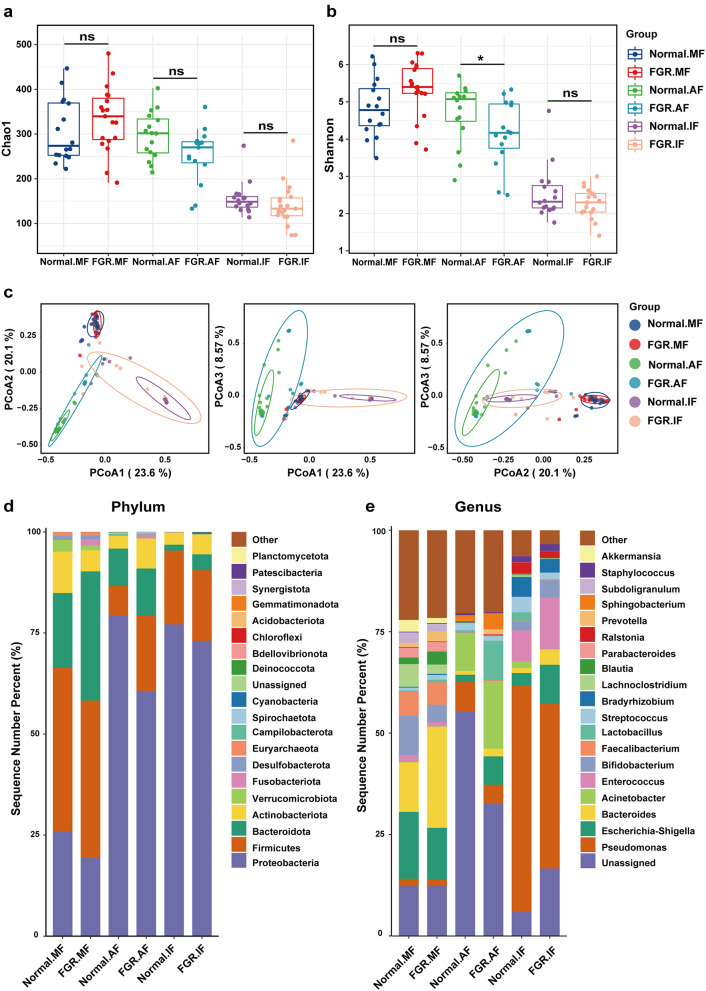
Fig. 1.
Overall microbiota diversity and microbial composition in each group. Diversity and composition of the overall microbiota between the FGR and control groups. Diversity of the overall microbiota between the FGR and control groups based on the (a) Chao1 richness and (b) Shannon diversity index. (c) Separation of FGR and control samples based on PCoA following the Bray–Curtis distance. The microbiota composition of the of FGR and control groups at the (d) phylum and (e) genus level. AF, amniotic fluid; IF, meconium; MF, maternal faeces. *p < 0.05

