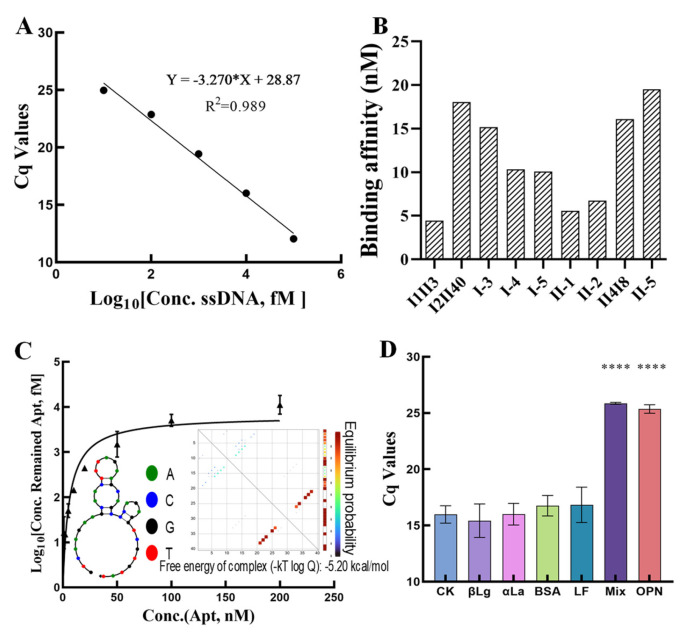
Figure 4.
(A): The ssDNA standard solutions through qPCR assay between ssDNA concentration and Cq values. (B): The preliminary affinity evaluation of the nine selected candidate sequences. (C): The affinity of Seq.I1II3 with seven concentration (Conc.) levels (0, 5, 10, 20, 50, 100, and 200 nM) based on the non-linear fitting method. (D): The specificity assessment of Seq.I1II3 (**** p < 0.0001).

