Fig. 1.
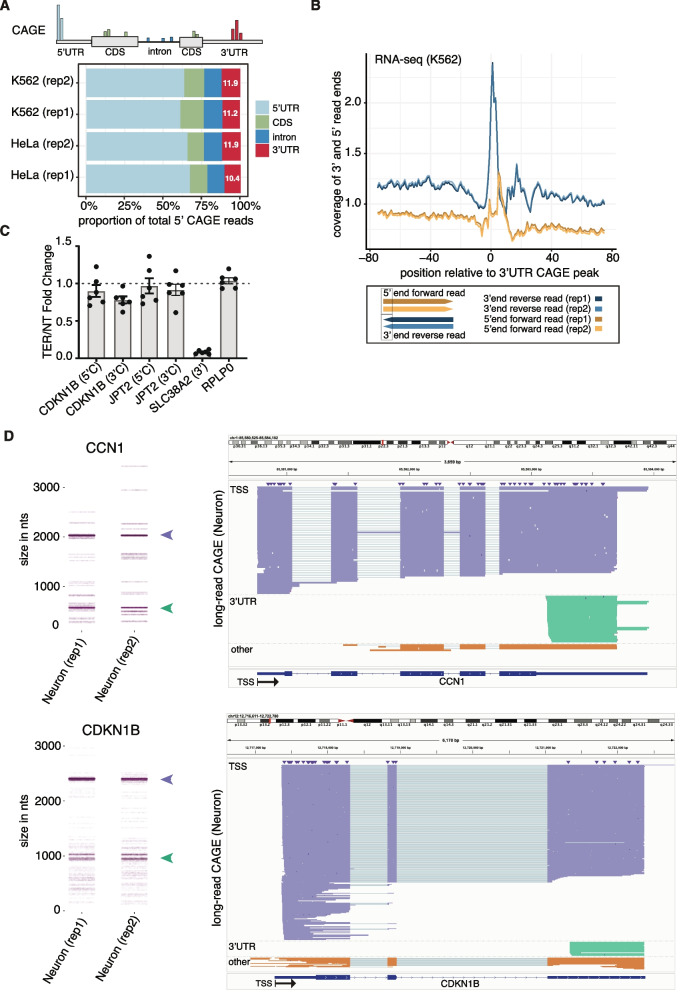
CAGE-seq identifies non-promoter associated capped 3′UTR-derived RNAs. A Top: Schematic representation of CAGE signals’ position across different transcript regions. Bottom: Bars indicate the proportion of total 5′ CAGE read positions per transcript region identified in CAGE-seq libraries of K562 and HeLa samples with two biological replicates each (rep1/2), provided by ENCODE (Additional file 2: Table S1—ENCSR000CJN and ENCSR000CJJ). B Top: Plot of the normalised coverage of the 5′ ends of forward paired-end reads (yellow lines) and 3′ ends of reverse paired-end reads (blue lines) of RNA-seq relative to 3′UTR CAGE peaks in K562 cells (Additional file 2: Table S1—ENCSR545DKY). Bottom: Schematic representation of paired-end read positioning. Forward and reversed paired-end reads are presented in yellow and blue, respectively, with the intensity of the colour indicating each of two biological replicates. The black box represents the ends of reads that are plotted in the top graph. C RT-qPCR data of gene expression ratios using primers amplifying regions immediately upstream (5′C) and downstream (3′C) of the 3′UTR CAGE peak, except for SLC38A2 whose 3′ cleavage site results in uncapped downstream fragment. Data is presented as a fold change of samples (six replicates) treated with TerminatorTM 5′-Phosphate-Dependent Exonuclease (TEX), which degrades 5′ monophosphate RNAs, versus non-treated (NT). Each dot represents the value of an independent biological replicate. D Long-read CAGE data (Additional file 2: Table S1—E-MTAB-14500) showing 3′ UTR-derived RNAs from CCN1 (above) and CDKN1B (below). Nanoblot plots (left) showing the range of read lengths at these genomic loci from two biological replicates in cortical neurons differentiated from induced pluripotent stem cells (rep1 and rep2), with long-read CAGE reads originating near the TSS (purple arrowhead) and those originating near the HeLa and K562 3′UTR CAGE peaks (green arrowhead) indicated. Genome browser visualisation (right) of the reads grouped and coloured in the same manner: 1_TSS (purple) originating near the TSS; 2_UTR (green) originating near the HeLa and K562 3′ UTR CAGE peaks and 3_OTHER (orange) originated at other sites

