Fig. 2.
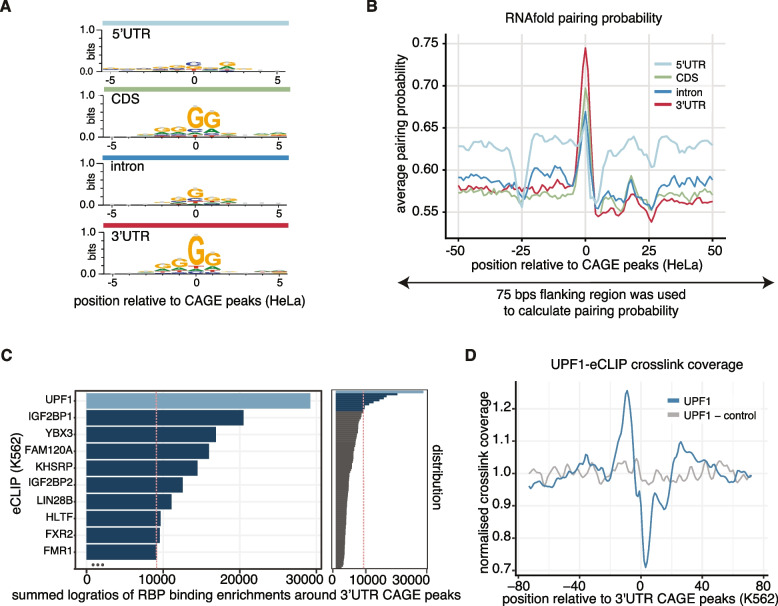
5′ ends of 3′UTR-derived RNAs are enriched in G-rich motifs and strong secondary structures and flanked by UPF1 binding sites. A Sequence logos around HeLa cells’ CAGE peaks across different transcript regions. B The 75-nt region centred on HeLa cells’ CAGE peaks at different transcript regions was used to calculate pairing probability with the RNAfold program, and the average pairing probability of each nucleotide is shown for the 50-nt region around CAGE peaks. C Enrichment of eCLIP cross-linking clusters surrounding 3′UTR CAGE peaks from 80 different RBP samples (right-hand side panel) in K562 cells from the ENCODE database (Additional file 2: Table S1—all eCLIP samples) using sum of log2 ratios of crosslink enrichments. The red line represents the threshold of top 10 RBP targets which are presented in detail in the left-hand side panel. D RNA-map [32] showing normalised density of UPF1 crosslink sites (Additional file 2: Table S1—ENCSR456ASB) relative to 3′UTR CAGE peaks (blue, UPF1) and random positions of the same 3′UTRs as control (grey, UPF1-control) in K562 cells

