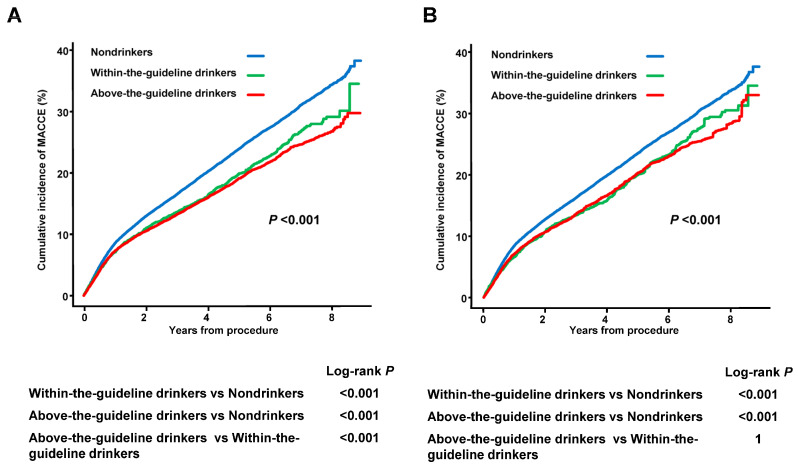
Figure 2.
The Kaplan–Meier Curves for MACCE According to Drinking Status in Crude (A) and IPW-matched Populations (B). The Kaplan–Meier curves demonstrated the highest MACCE incidence in non-drinkers and the lowest in above-the-guideline drinkers in both the crude and IPW populations (log-rank p < 0.001). n = 77,409. A log-rank test was utilized for statistical analyses. IPW, inverse probability-weighted; MACCE, major adverse cardiovascular and cerebrovascular events.

