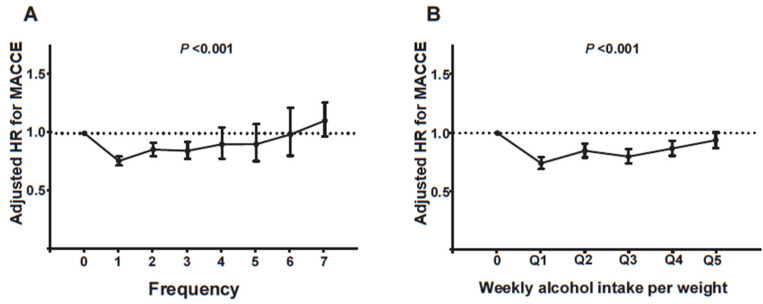
Figure 3.
MACCE risk according to frequency (times per week) (A) and bodyweight-adjusted amount of drinking (B). Drinking frequency, defined by the number of drinks consumed per week, showed a J-curve relationship with the IPW-aHR of MACCE. The MACCE risk was the lowest in patients who drank alcohol once a week and gradually increased with alcohol intake frequency. (A) When weekly alcohol intake per body weight was divided into quintiles, a J-curve relationship was also found between body weight-adjusted drinking amount and clinical outcomes. (B) Q1, ≤0.33g/kg/week; Q2, 0.33g/kg/week ˂ to ≤0.63g/kg/week; Q3, 0.63g/kg/week ˂ to ≤1.09g/kg/week; Q4, 1.09g/kg/week ˂ to ≤2.11g/kg/week; Q5, >2.11 g/kg/week. n = 77,409. The Multivariable Cox regression model was utilized for statistical analyses. HR, hazard ratio; IPW, inverse probability-weighted; MACCE, major adverse cardiovascular and cerebrovascular events.

