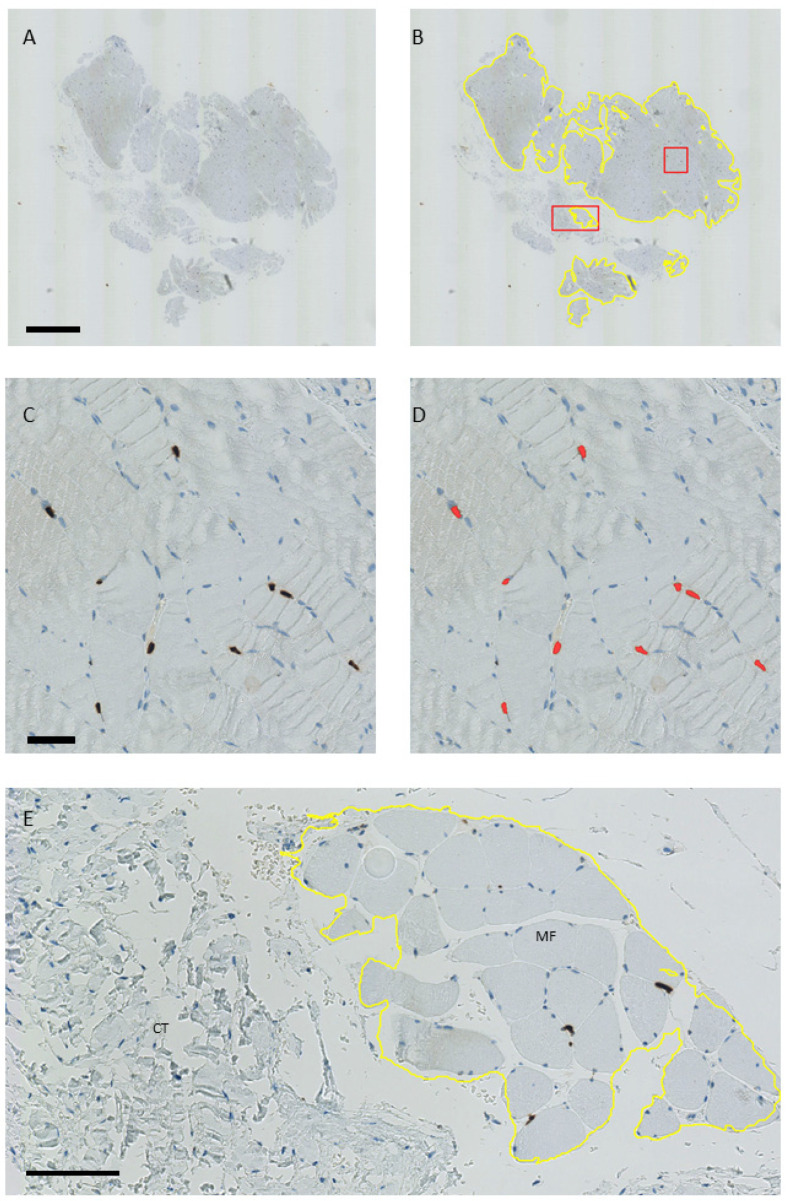
Figure A2.
Analyses of Pax7-positive nuclei per area in QuPath. (A,B): Whole slide view of a muscle biopsy. (B) The yellow line was drawn around areas of muscle fibers, excluding connective tissue and artifacts. (C) Magnification of the red square from (B), showing Pax7-positive nuclei stained with DAB (dark brown). (D) Detection of Pax7-positive nuclei with QuPath (red). (E) Magnification of the red rectangle in (B) showing areas of connective tissue (CT) and muscle fibers (MF). Scale bars for (A,B) = 1 mm; (C,D) = 50 µm; and (E) = 100 µm.

