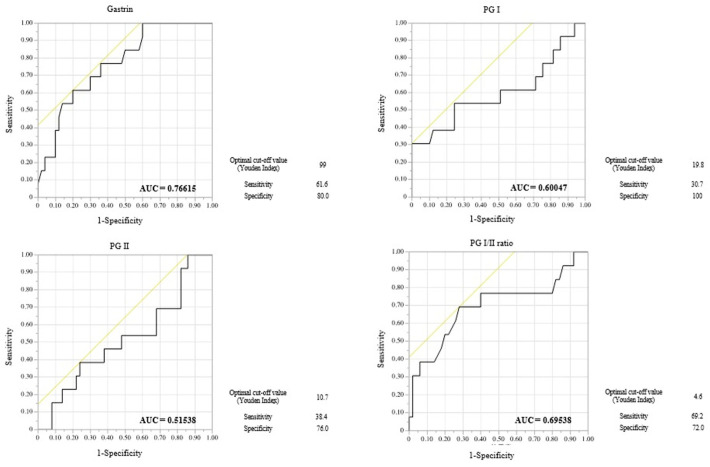
Figure 3.
ROC curves for predictive performance of serum marker in metachronous GCAE.The yellow line in the figure serves as a reference line, representing the baseline for random classification. Positioned at a 45-degree angle, this line indicates the performance of a model with no predictive power. ROC curves that appear above this line suggest that the model’s predictive ability is better than random chance.

