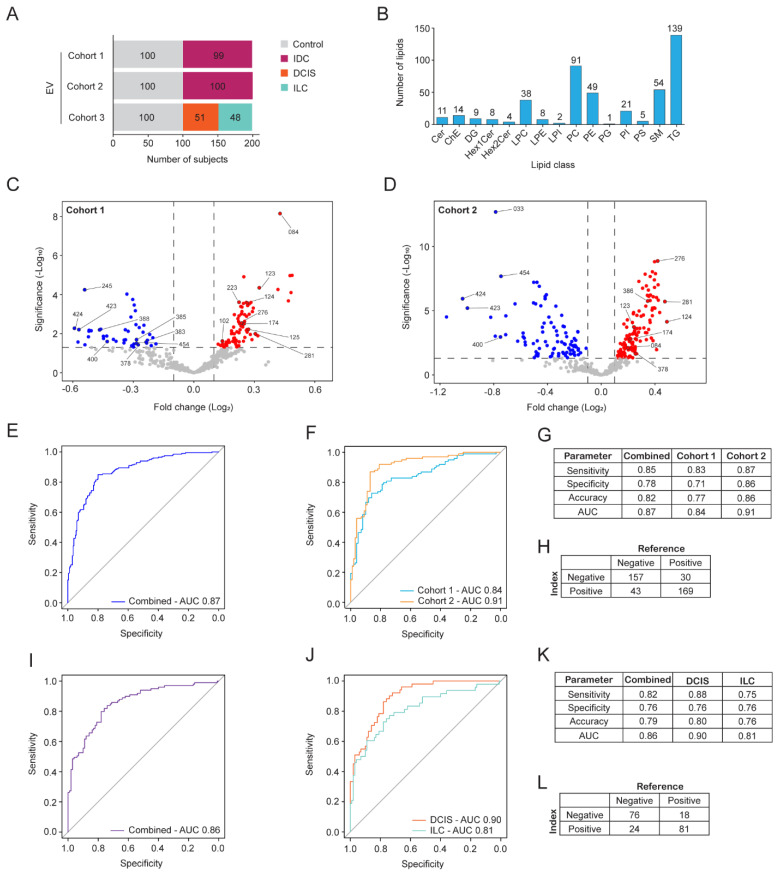
Figure 1.
Logistic regression-based EV lipid discovery for breast cancer detection. (A) Overview of the sample set (n = 598) used in EV lipid discovery. EVs were enriched from plasma samples obtained from three cohorts of women with three morphologically distinct breast cancer types or healthy controls. (B) Number of lipid species in each lipid class that were consistently detected in cohorts 1-2. (C,D) Volcano plots of lipid profiles identified in EVs from breast cancer subjects compared to controls from (C) cohort 1 and (D) cohort 2. The fold-change in relative lipid abundance is shown. Lipid species that were significantly decreased (blue dots) or increased (red dots) in breast cancer samples are indicated, and lipids chosen for further assessment are annotated with a number (LID). (E,F) ROC curves for the internal validation using the logistic regression model for the EV23 panel to predict the presence of IDC from EVs in cohorts 1 and 2. (E) Cohort 1 and 2 combined. (F) Cohort 1 and 2 shown separately. (G) Model prediction outputs from (E,F). (H) Confusion matrix indicating model predictions from combined data in (G). (I,J) ROC curves for the internal validation using the logistic regression model for the EV23 panel to predict the presence of DCIS and ILC from EVs in cohort 3. (I) DCIS and ILC samples combined. (J) Predictions of DCIS and ILC shown separately. (K) Model prediction outputs from (I,J). (L) Confusion matrix indicating model predictions from combined data in (K). Optimized threshold in (G,H) was 0.43 and in (K,L) it was 0.41. LID, lipid identifier.

