Figure 3.
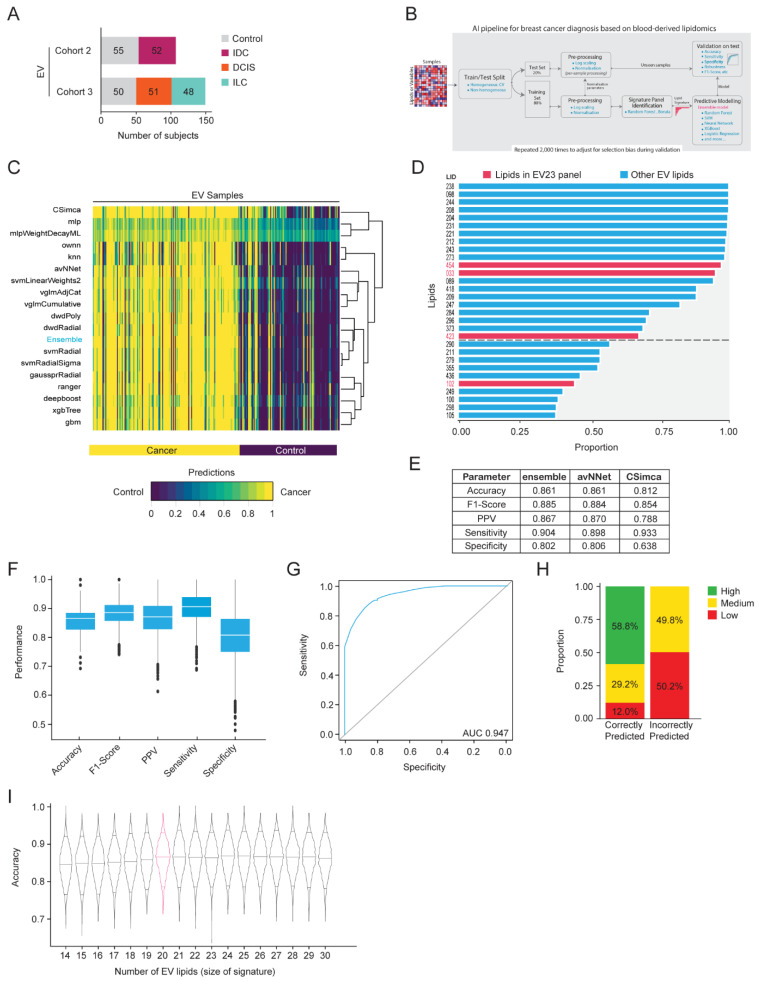
Machine learning-based EV lipid discovery for breast cancer detection. (A) Overview of the sample set (n = 256) used in the machine learning EV lipid discovery. EVs were enriched from plasma samples obtained from two cohorts of women with three morphologically distinct types of breast cancer or healthy controls. (B) A machine learning biomarker discovery pipeline was developed for signature panel identification and predictive model development. (C) Average prediction of each model for individual donor samples across 2000 runs. Values closer to 0 (purple) indicate a stronger prediction as control, while values closer to 1 (yellow) indicate a stronger prediction as cancer. (D) Lipids that are consistently selected as being important by the Boruta algorithm across all runs. The cutoff between the top 20 and the remaining 10 lipids is indicated with a dotted line. Lipids from the EV23 panel are indicated with red text and bars. (E–H) Results using the top 20 lipids from (D) as variables and using the (E) indicated models or (F–H) the ensemble model, trained using LGOCV (20% test, 80% train) and repeated 2000 times. (E) Test performance summary of the three models with the highest sensitivity. (F) Boxplots with interquartile range are indicated, representing the distribution of performance metrics. (G) Average ROC curve and AUC. (H) Certainty level of predictions. High: complete model agreement, medium: greater than 80% model agreement, low: less than 80% model agreement. Proportion (%) of high, medium, and low predictions are indicated. (I) Sensitivity analysis on the EV ensemble model with varying numbers of lipids. The violin plots represent the distribution of the ensemble model accuracy such that the top 14 to 30 lipids were selected based on (D). Horizontal lines within each violin represent the 0.05, 0.5, and 0.95 quantiles for prediction accuracy. The signature size with the best accuracy and the fewest lipids is indicated by a pink density curve. LID, lipid identifier.

