Figure 5.
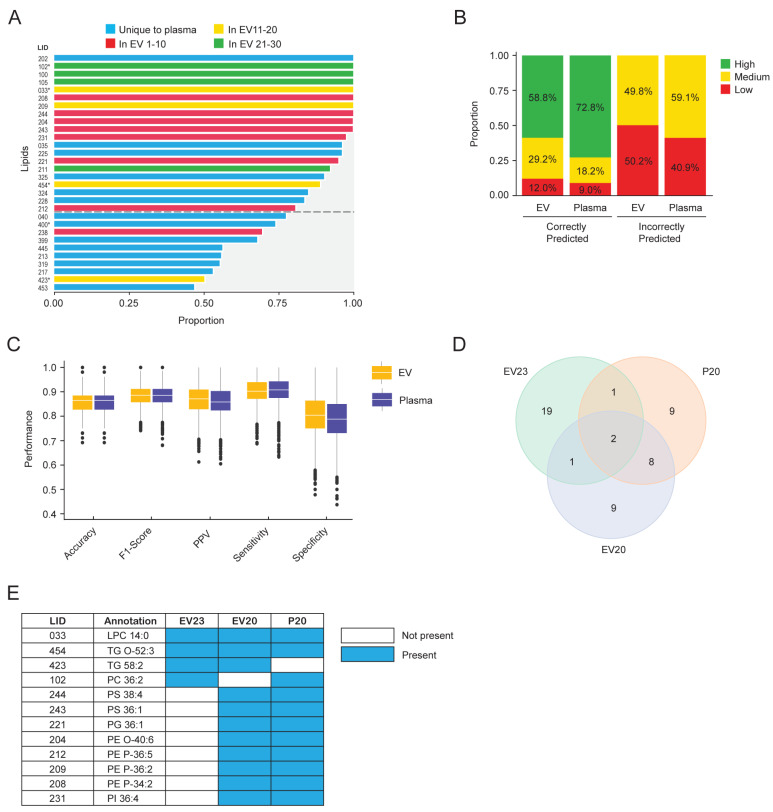
Comparison of Plasma- and EV-derived lipid signatures to predict breast cancer. (A) Comparison of the lipids that were consistently selected as being important in both plasma and EVs using the machine learning discovery pipeline. Lipids that were consistently selected as being important by the Boruta algorithm across all plasma runs are shown. Blue bars indicate lipids that were unique to the plasma analysis. Red, yellow, and green bars indicate lipids that were also identified in the top 30 lipids in the EV analysis. Lipids identified in the EV23 panel are indicated with an asterisk (*) next to the LID. The cutoff between the top 20 and the remaining 10 lipids is indicated with a dotted line. (B,C) Comparison of the results using the top 20 lipids from plasma and EVs and using the ensemble model. (B) Certainty level of predictions on correctly classified and incorrectly classified samples. High: complete model agreement, medium: greater than 80% model agreement, low: less than 80% model agreement. Proportion (%) of high, medium, and low predictions are indicated. (C) Boxplots and the interquartile range representing the distribution of the indicated performance metrics. (D) Venn diagram indicating how the EV 23 panel (EV23), Boruta plasma 20-lipid panel (P20), and Boruta EV 20-lipid panel (EV20) overlap. (E) LID and sum composition annotation of lipid species that were found in the overlapping regions of the Venn diagram in (D). Lipid species that have been described in association with breast cancer in the literature are indicated. LID, lipid identifier.

