Figure 6.
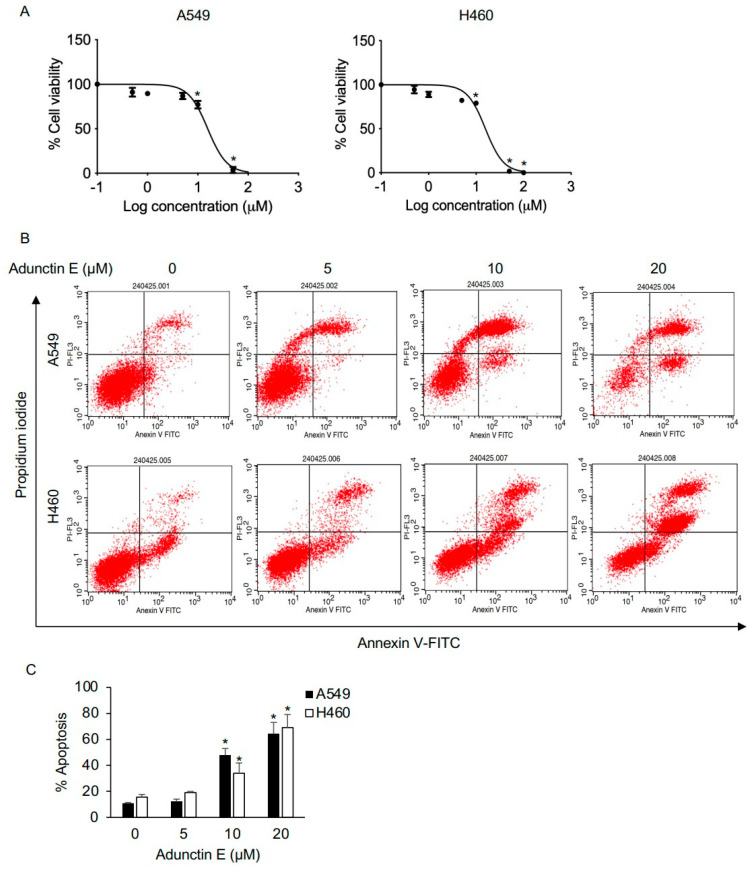
In vitro cytotoxicity and apoptosis induction of adunctin E. (A) A549 and H460 cells were treated with adunctin E (0–100 μM) for 48 h. Cell viability was determined by MTT assay. Plots are presented as a percentage of cell viability. (B) Apoptosis cells were evaluated by annexin-V/propidium iodide (PI) staining. Representative histograms from the flow cytometry analysis are shown. (C) The number of early (annexin-V+, PI–) and late (annexin-V+, PI+) apoptotic cells were plotted. Data are presented as the mean ± SEM (n = 3). * p < 0.05 vs. untreated control cells.

