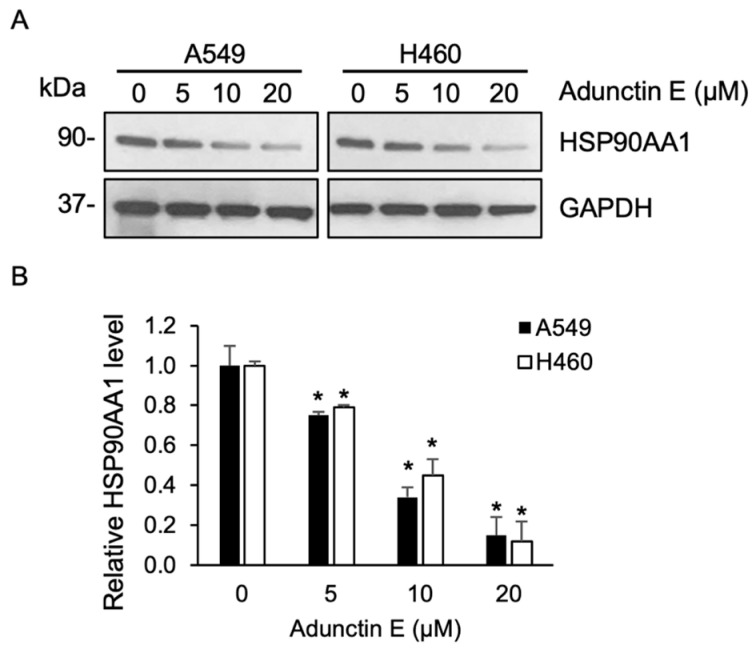
Figure 8.
(A) A549 and H460 cells were treated with adunctin E (0–20 μM) for 48 h. The expression of HSP90AA1 was analyzed by immunoblotting. Blots were reprobed with anti-GAPDH antibody to ensure equal loading. Representative blots from triplicate independent experiments are shown. (B) HSP90AA1 protein levels were quantified and normalized with those of GAPDH. Relative HSP90AA1 protein levels were plotted. Data are presented as mean ± SEM (n = 3). * p < 0.05 vs. untreated control cells.

