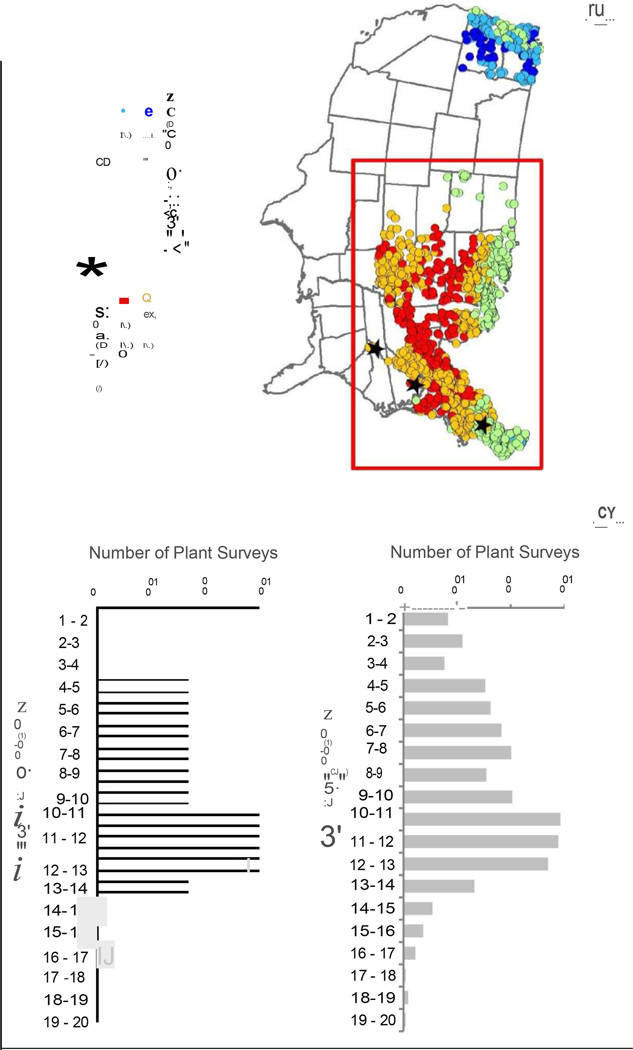
Figure 3.
a) Total N deposition (2000 – 2013 average) for plots with co-located vegetation surveys and soil chemistry data (n = 1,214) used to develop the U.S. PROPS database. The red outline encompasses the plots located in the northern and eastern U.S. (n = 1,057). Survey data from plots located in the west are not relevant for the indicator species analyzed in this study. Among the modelled indicator species, only Maianthemum canadense is distributed throughout the geographic extent represented by all 1,214 plots. b) Distribution of total N deposition among all sites (n = 1,214) and c) distribution of total N deposition among sites located in the northern and eastern U.S. (n = 1,057) used for US PROPS model development.

