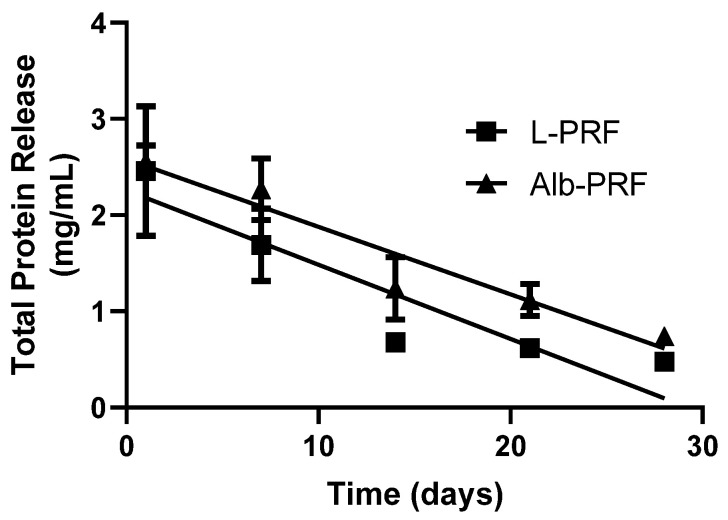
Figure 4.
Quantification of total proteins released into the culture medium after exposure to L-PRF and Alb-PRF membranes for 1, 7, 14, 21 and 28 days. Points indicate mean and standard deviation (n = 5). The lines present linear regressions with R2 values of 0.8293 and 0.8639 for L-PRF and Alb-PRF, respectively.

