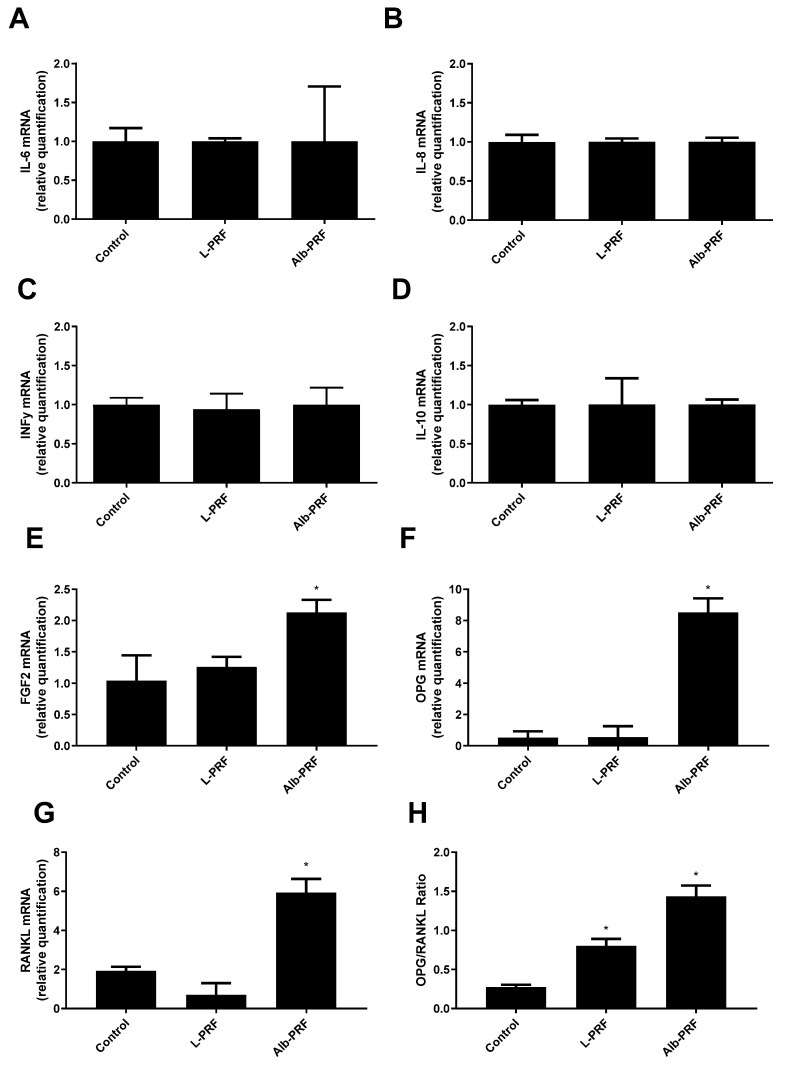
Figure 10.
Quantification of mRNA expression of different inflammatory and bone metabolism-related markers, after exposure of MG-63 osteoblasts to 25% conditioned media for 1 day. (A) IL-6; (B) IL-8; (C) IFN-y; (D) IL-10; (E) FGF2; (F) OPG; (G) RANKL; the (H) OPG/RANKL ratio. Bars indicate the mean and standard deviation (n = 3). (*) Significantly different from all other groups (p < 0.05). Results were calculated as a proportion of Glyceraldehyde 3-phosphate dehydrogenase (GAPDH) expression.

