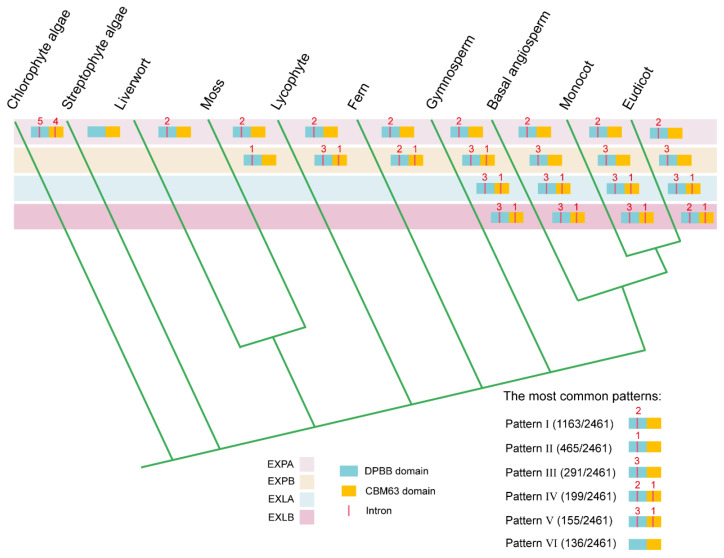
Figure 3.
Intron distribution patterns within the DPBB and CBM63 domains across ten lineages. A simplified phylogeny of green plants was drawn according to Leebens-Mack JH et al. and Jia Q et al. [33,39]. Introns in the DPBB and CBM63 domains are indicated by red vertical lines. The red numerals represent the number of introns corresponding to the most common pattern (i.e., the largest percentage) in each subfamily across different lineages.

