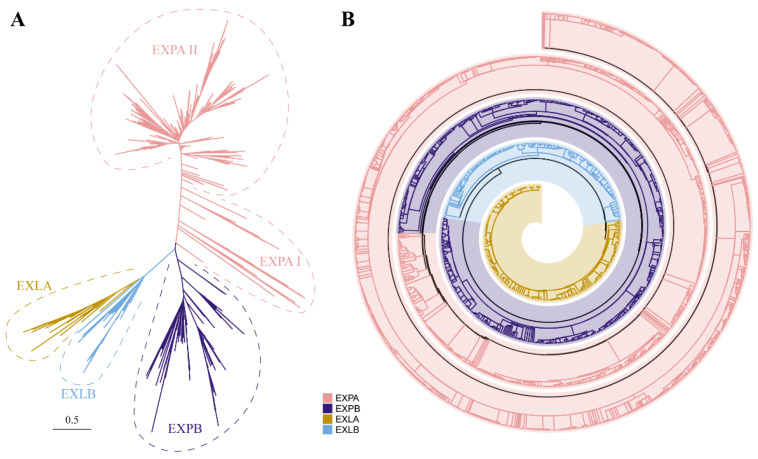
Figure 4.
Phylogenetic analysis of expansins in green plants. (A) Phylogenetic tree topology of 2461 expansins across 57 species. Different clades within the EXPA subfamily are denoted by Roman numerals. The tree was constructed using IQ-TREE with the best-fitting model (Q.pfam + R9) and visualized using iTOL v5. The scale bar indicates an evolutionary distance of 0.5 nucleotides per position in the sequence. (B) Spiral diagram of the phylogenetic tree of 2461 expansins across 57 species. Each subfamily is labeled with a specific color. The tree was constructed using IQ-TREE with the best-fitting model (Q.pfam + R9) and visualized using the R package spiralize (v1.1.0). The phylogenetic tree, including all bootstrap values, is presented in Figure S2.

