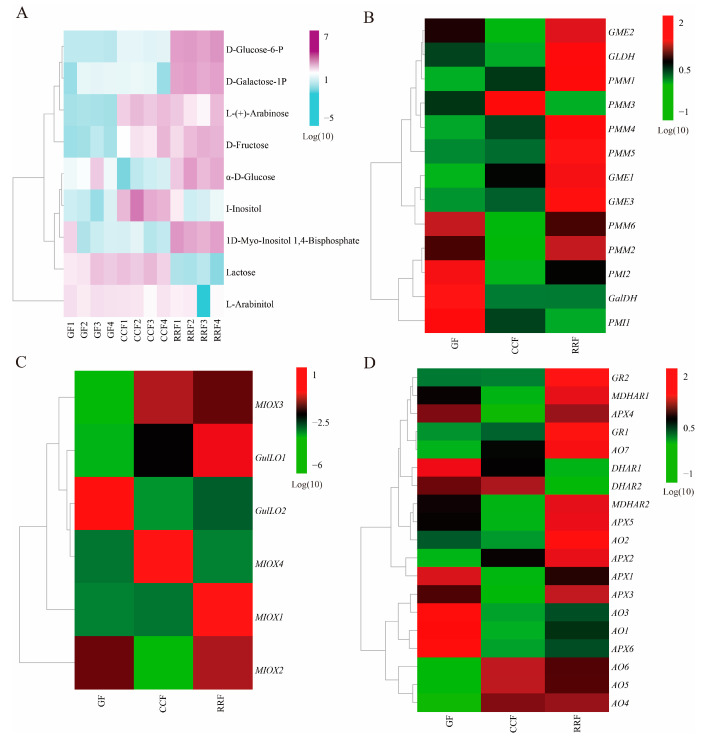
Figure 4.
The heatmap and hierarchical cluster illustrating the DAMs and DEGs associated with AsA synthesis pathway in L. chinense fruits across three developmental stages. (A) The heatmap of the DAMs related to AsA metabolism, with colors representing the accumulation levels of each metabolite, ranging from low (light green) to high (purple). (B) The heatmap of the DEGs involved in the L-Galactose pathway of AsA synthesis. (C) The heatmap of the DEGs associated with the L-Gulose and Myo-inositol pathways of AsA synthesis. (D) The heatmap of the DEGs related to the AsA-GSH cycle, which is crucial for the oxidation and reduction of AsA. Colors indicate the accumulation levels of each transcript, from low (green) to high (red).

