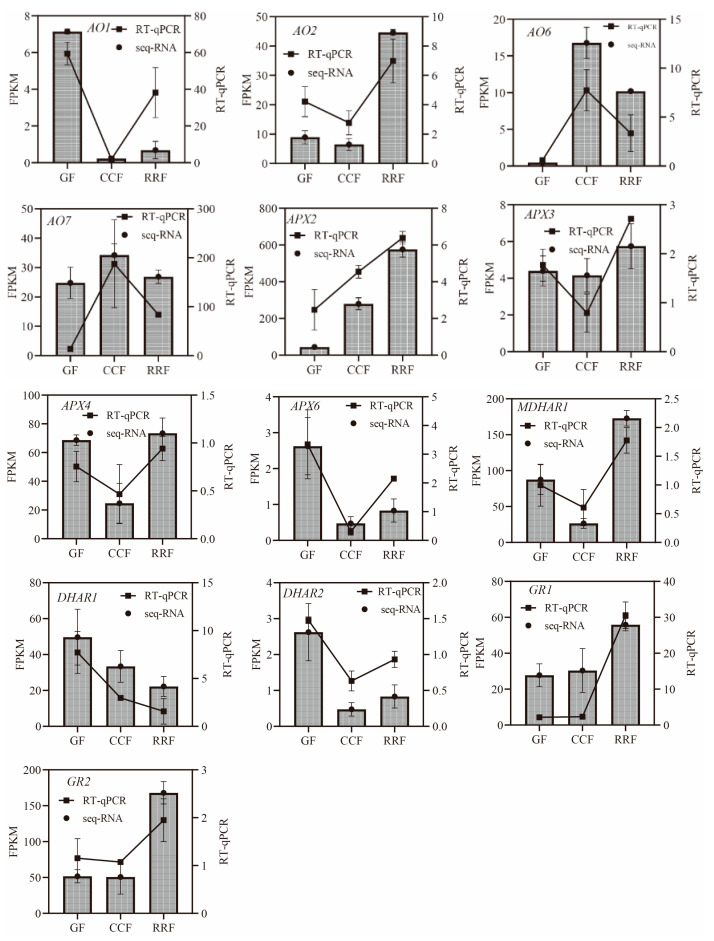
Figure 6.
The expression of genes in the ASA-GSH cycle, which is part of the AsA oxidation and reduction pathway, was analyzed by RT-qPCR in L. chinense fruits at three developmental stages: GF, CCF, and RRF. The column chart illustrated the FPKM values of the genes, while the line chart depicted the relative gene expression by RT-qPCR. Relative gene expression was calculated using the 2−ΔΔct method. Vertical bars represented the means ± SD from three replicates.

