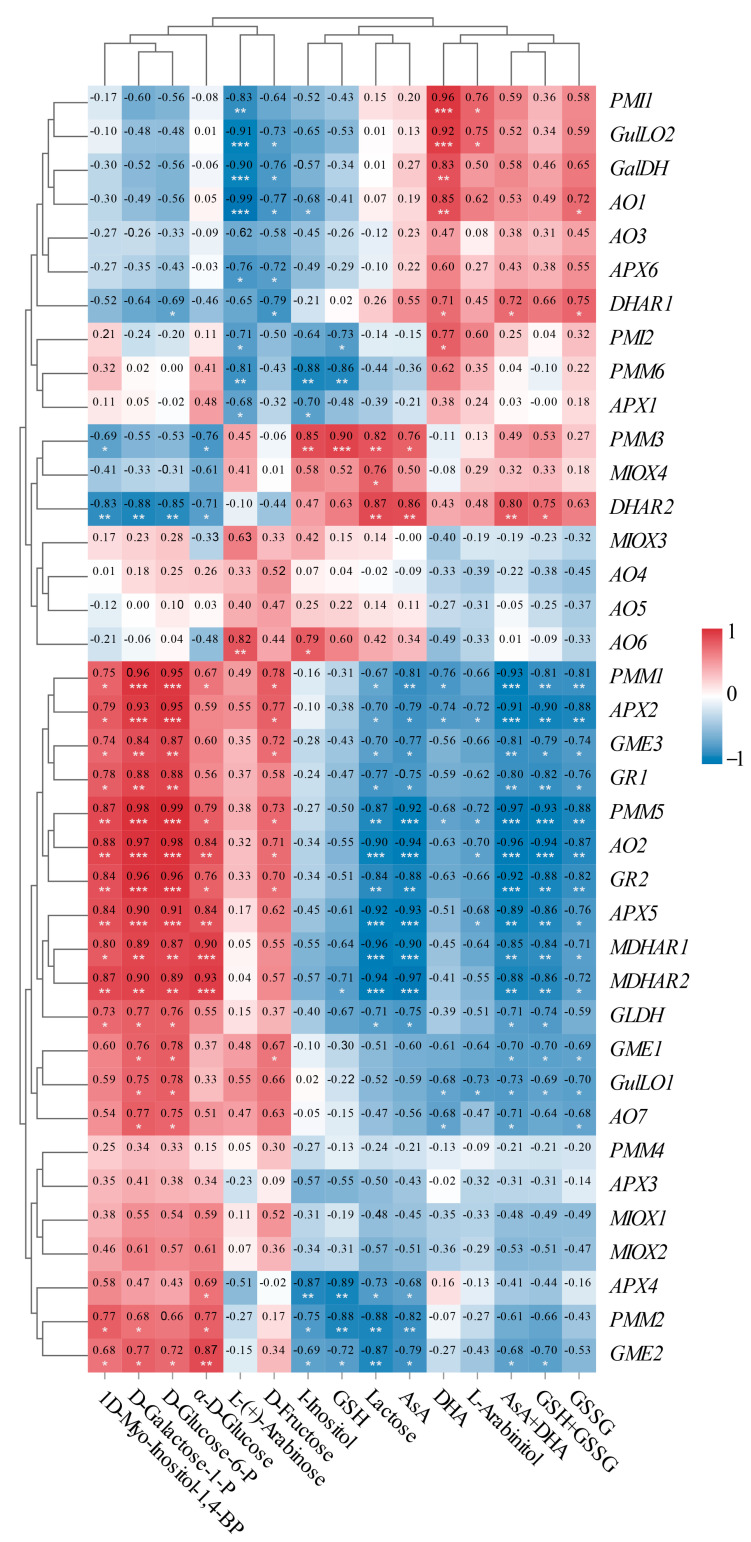
Figure 9.
Correlation analysis between the expressions of 38 unigenes and 15 metabolites involved in AsA metabolism in L. chinense fruits. Red and blue colors indicated positive and negative correlation, respectively. The significance levels were denoted as follows: * indicated 0.01 < p < 0.05; ** indicated 0.001 < p < 0.01; and *** indicated p ≤ 0.001.

