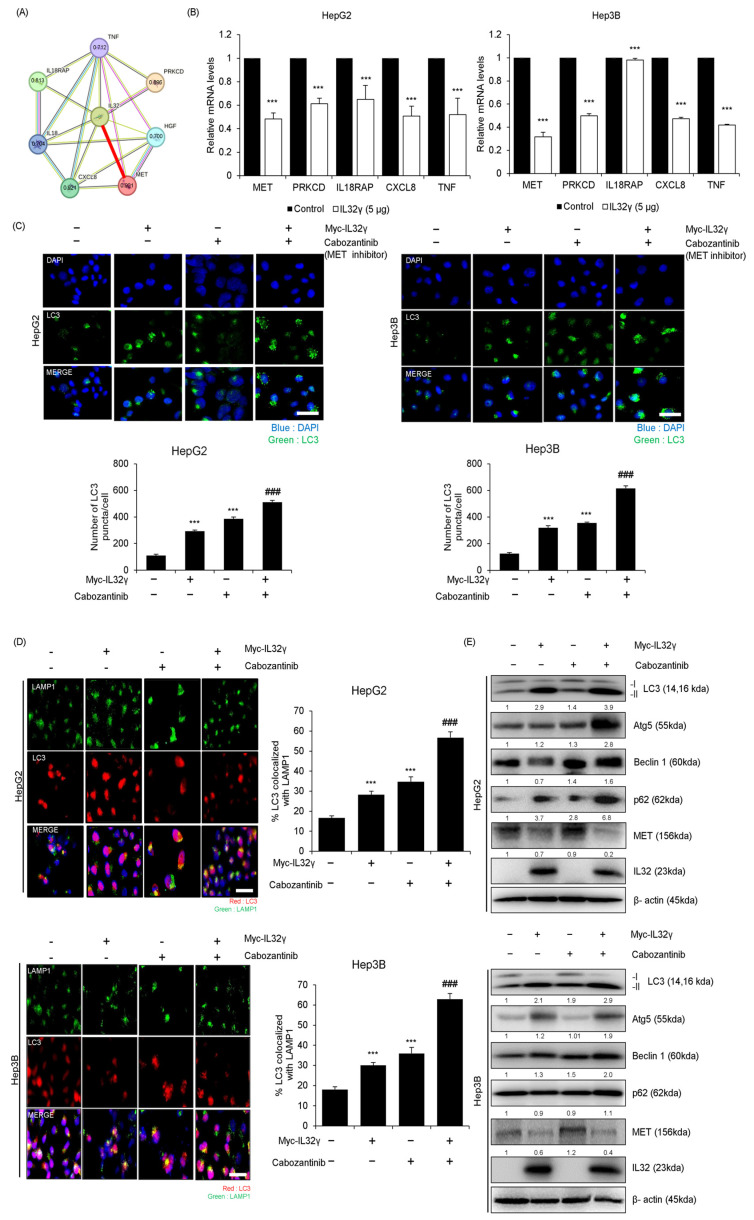
Figure 3.
Association between IL-32γ and MET pathway. (A) Protein-association network analysis of IL-32γ and MET and its predicted target proteins using the STRING database. The red line represents the robust interaction between IL-32 and MET. This value means a combined score with IL-32 and MET, its predicted target proteins in the STRING database. (B) HepG2 and Hep3B cells were transfected with IL-32γ (5 μg) for 24 h. The mRNA level of MET, PRKCD, IL18RAP, CXCL8, and TNF was measured by RT-qPCR. Data are presented as mean ± S.D. from three independent experiments. ***, p < 0.001 indicates statistically significant differences from the control group. (C) HepG2 and Hep3B cells were transfected with IL-32γ (2 μg) or Cabozantinib (2 μM) for 24 h. Transfected cells were stained with LC3 antibody. Using fluorescent microscopy, LC3 puncta formation was detected. The number of LC3 puncta per cell was calculated. The data was the average of three independent experiments, and error bars were mean ± SD. ***, p < 0.001. Scale bar, 100 μm. ### indicates statistically significant differences from the Cabozantinib or IL-32γ group. (D) The cells were fixed and permeabilized. Cells were immunostained with LAMP1 (green) and LC3 (red) during fusion with autophagosomes and lysosomes. The cell nucleus was stained with DAPI (blue). Autolysosome localization was observed by fluorescence microscopy. The data was the average of three independent experiments, and error bars were mean ± SD. ***, p < 0.001. Scale bar, 100 μm. ### indicates statistically significant differences from the Cabozantinib or IL-32γ group. (E) The expression of autophagy-related proteins determined using western blotting.

